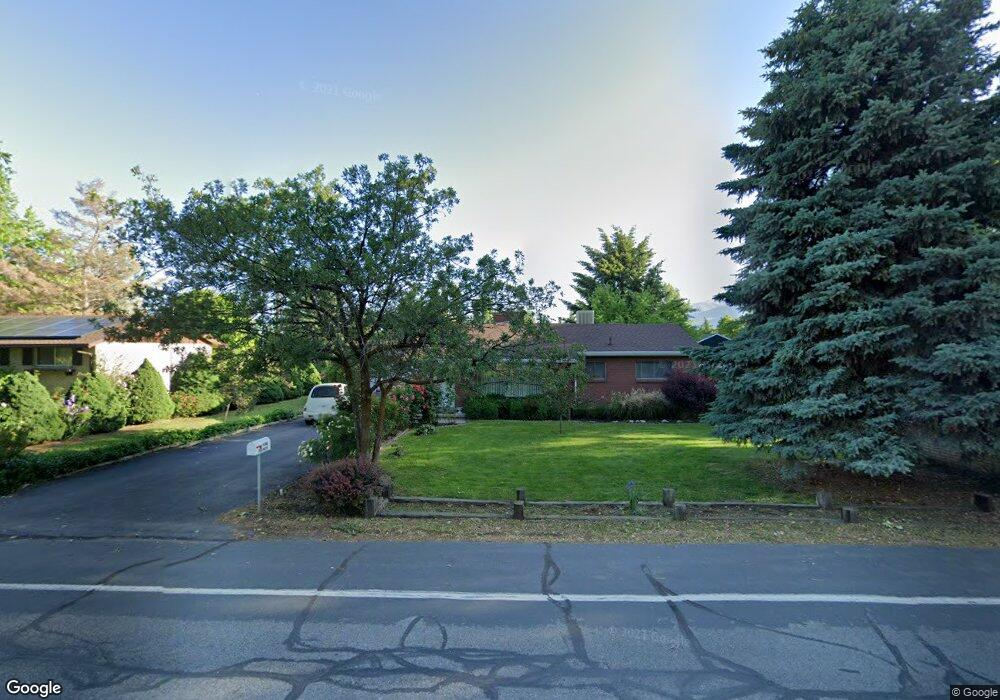
758 W 1000 N West Bountiful, UT 84087
Estimated Value: $469,195 - $494,000
3
Beds
1
Bath
1,040
Sq Ft
$460/Sq Ft
Est. Value
About This Home
This home is located at 758 W 1000 N, West Bountiful, UT 84087 and is currently estimated at $478,549, approximately $460 per square foot. 758 W 1000 N is a home located in Davis County with nearby schools including West Bountiful Elementary School, Bountiful Junior High School, and Viewmont High School.
Ownership History
Date
Name
Owned For
Owner Type
Purchase Details
Closed on
May 27, 2020
Sold by
Earl Lisa Mae and Estate Of Mae Mccullough King
Bought by
Ferguson Haylie Anne
Current Estimated Value
Home Financials for this Owner
Home Financials are based on the most recent Mortgage that was taken out on this home.
Original Mortgage
$283,500
Outstanding Balance
$250,745
Interest Rate
3.2%
Mortgage Type
New Conventional
Estimated Equity
$227,804
Create a Home Valuation Report for This Property
The Home Valuation Report is an in-depth analysis detailing your home's value as well as a comparison with similar homes in the area
Home Values in the Area
Average Home Value in this Area
Purchase History
| Date | Buyer | Sale Price | Title Company |
|---|---|---|---|
| Ferguson Haylie Anne | -- | Us Title Company Of |
Source: Public Records
Mortgage History
| Date | Status | Borrower | Loan Amount |
|---|---|---|---|
| Open | Ferguson Haylie Anne | $283,500 |
Source: Public Records
Tax History Compared to Growth
Tax History
| Year | Tax Paid | Tax Assessment Tax Assessment Total Assessment is a certain percentage of the fair market value that is determined by local assessors to be the total taxable value of land and additions on the property. | Land | Improvement |
|---|---|---|---|---|
| 2025 | $2,802 | $217,800 | $169,622 | $48,178 |
| 2024 | $2,586 | $209,550 | $140,404 | $69,146 |
| 2023 | $2,331 | $368,000 | $259,114 | $108,886 |
| 2022 | $2,516 | $210,650 | $129,478 | $81,172 |
| 2021 | $2,213 | $301,000 | $184,744 | $116,256 |
| 2020 | $1,829 | $243,000 | $163,982 | $79,018 |
| 2019 | $1,908 | $241,000 | $159,291 | $81,709 |
| 2018 | $1,643 | $213,000 | $150,451 | $62,549 |
| 2016 | $1,457 | $103,896 | $48,670 | $55,226 |
| 2015 | $1,452 | $94,491 | $48,670 | $45,821 |
| 2014 | $71 | $89,866 | $48,670 | $41,196 |
| 2013 | -- | $84,007 | $37,674 | $46,333 |
Source: Public Records
Map
Nearby Homes
- 825 W 1320 N
- 637 W 1600 N
- 790 N 500 W
- 366 W 1000 N
- 767 W 220 N
- Lincoln Farmhouse Plan at Belmont Farms
- Belmont Traditional Plan at Belmont Farms
- Hampton Traditional Plan at Belmont Farms
- 340 N 500 W Unit 204
- 1084 W Audrey Ln Unit 20
- 1084 W Audrey Ln
- 789 W 1950 N
- 399 W 400 N Unit 47
- 1503 N 300 W
- 280 N 1100 W
- 235 W 1400 N
- 553 N 200 W
- 2035 N 800 W
- 1194 N 200 W
- 499 N 200 W Unit 30