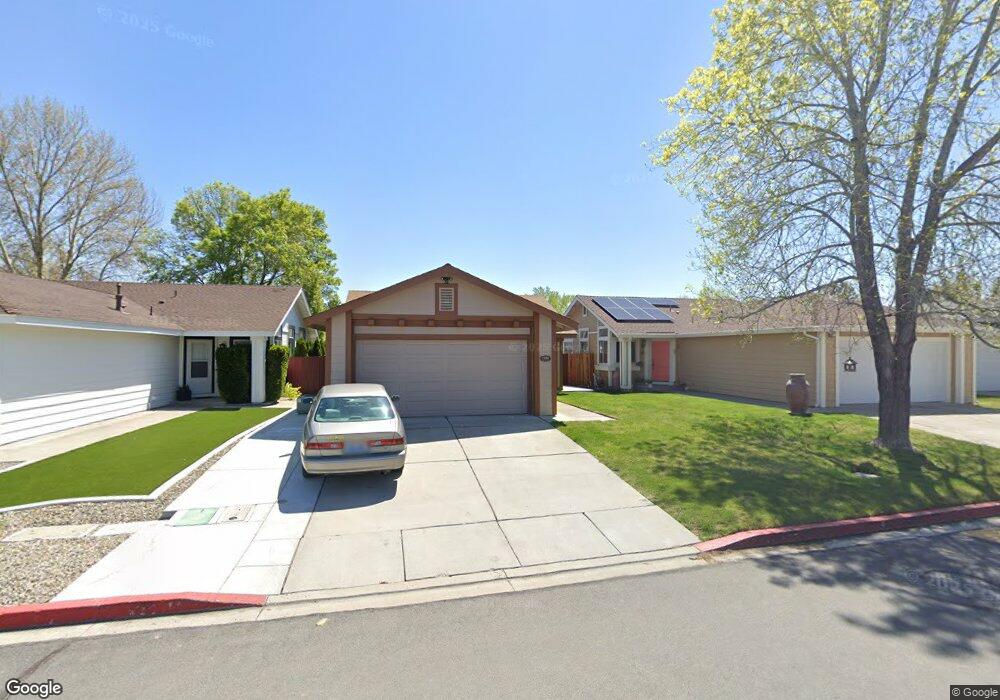
7580 Devonshire Ln Unit 2 Reno, NV 89511
Bartley Ranch NeighborhoodEstimated Value: $377,000 - $514,000
3
Beds
2
Baths
1,049
Sq Ft
$431/Sq Ft
Est. Value
About This Home
This home is located at 7580 Devonshire Ln Unit 2, Reno, NV 89511 and is currently estimated at $452,123, approximately $431 per square foot. 7580 Devonshire Ln Unit 2 is a home located in Washoe County with nearby schools including Huffaker Elementary School, Edward L Pine Middle School, and Reno High School.
Ownership History
Date
Name
Owned For
Owner Type
Purchase Details
Closed on
Apr 28, 2016
Sold by
Smith Constance J
Bought by
Purke Shearer Phoebe R
Current Estimated Value
Home Financials for this Owner
Home Financials are based on the most recent Mortgage that was taken out on this home.
Original Mortgage
$177,600
Outstanding Balance
$140,560
Interest Rate
3.73%
Mortgage Type
New Conventional
Estimated Equity
$311,563
Purchase Details
Closed on
Dec 15, 2004
Sold by
Oday Patrick E
Bought by
Smith Constance J
Home Financials for this Owner
Home Financials are based on the most recent Mortgage that was taken out on this home.
Original Mortgage
$216,000
Interest Rate
6.12%
Mortgage Type
New Conventional
Create a Home Valuation Report for This Property
The Home Valuation Report is an in-depth analysis detailing your home's value as well as a comparison with similar homes in the area
Home Values in the Area
Average Home Value in this Area
Purchase History
| Date | Buyer | Sale Price | Title Company |
|---|---|---|---|
| Purke Shearer Phoebe R | $222,000 | Ticor Title | |
| Smith Constance J | $270,000 | Ticor Title Of Nevada Inc |
Source: Public Records
Mortgage History
| Date | Status | Borrower | Loan Amount |
|---|---|---|---|
| Open | Purke Shearer Phoebe R | $177,600 | |
| Previous Owner | Smith Constance J | $216,000 | |
| Closed | Smith Constance J | $40,500 |
Source: Public Records
Tax History
| Year | Tax Paid | Tax Assessment Tax Assessment Total Assessment is a certain percentage of the fair market value that is determined by local assessors to be the total taxable value of land and additions on the property. | Land | Improvement |
|---|---|---|---|---|
| 2026 | $1,474 | $74,308 | $39,270 | $35,039 |
| 2024 | $1,924 | $72,487 | $36,120 | $36,367 |
| 2023 | $1,869 | $70,261 | $35,700 | $34,561 |
| 2022 | $1,815 | $58,917 | $29,995 | $28,922 |
| 2021 | $1,680 | $52,573 | $23,625 | $28,948 |
| 2020 | $1,579 | $50,352 | $21,210 | $29,142 |
| 2019 | $1,505 | $48,900 | $20,545 | $28,355 |
| 2018 | $1,433 | $42,283 | $14,455 | $27,828 |
| 2017 | $1,378 | $42,447 | $14,455 | $27,992 |
| 2016 | $1,343 | $41,768 | $12,460 | $29,308 |
| 2015 | $1,341 | $40,174 | $10,780 | $29,394 |
| 2014 | $1,303 | $37,472 | $8,750 | $28,722 |
| 2013 | -- | $34,154 | $6,510 | $27,644 |
Source: Public Records
Map
Nearby Homes
- 7665 Water View Way
- 831 Blue Falls Place
- 7541 Lighthouse Ln
- 7293 Blue Falls Cir
- 7554 Whimbleton Way Unit 6
- 7895 Meadow Vista Dr
- 7960 Meadow Vista Dr
- 555 E Patriot Blvd Unit 266
- 555 E Patriot Blvd Unit G195
- 8211 Dixon Ln
- 7640 Bluestone Dr Unit 3
- 8790 Dixon Ln
- 422 Barclay Ct
- 7680 Bluestone Dr Unit 411
- 7680 Bluestone Dr
- 7541 Cumberland Cir
- 5428 Phillipa Dr
- 7275 Offenhauser Dr
- 84 Caballada St
- 1551 Delucchi Ln Unit F
- 7574 Devonshire Ln Unit 2
- 7586 Devonshire Ln
- 7568 Devonshire Ln
- 7592 Devonshire Ln
- 7583 Water View Way
- 7589 Water View Way
- 7598 Devonshire Ln
- 7595 Water View Way
- 7581 Devonshire Ln
- 7587 Devonshire Ln
- 7571 Water View Way
- 7575 Devonshire Ln
- 7593 Devonshire Ln
- 7593 Devonshire Ln Unit 1
- 7569 Devonshire Ln
- 7601 Water View Way
- 7565 Water View Way
- 7599 Devonshire Ln
- 7563 Devonshire Ln
- 7607 Water View Way
Your Personal Tour Guide
Ask me questions while you tour the home.