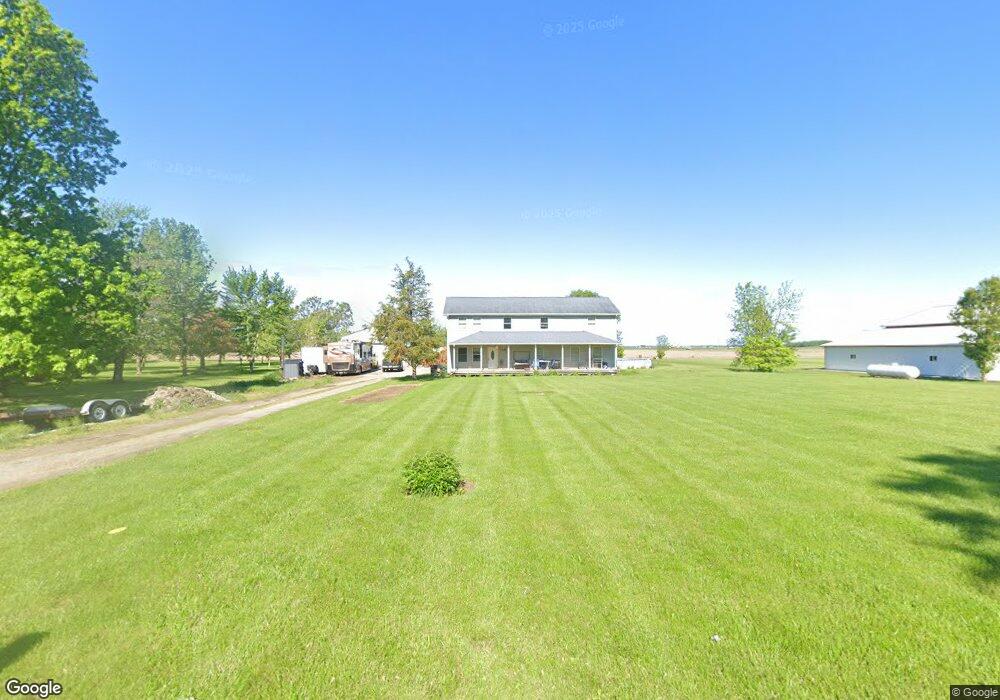
7583 W Front St Paulding, OH 45879
Estimated Value: $164,000 - $362,000
3
Beds
1
Bath
1,124
Sq Ft
$253/Sq Ft
Est. Value
About This Home
This home is located at 7583 W Front St, Paulding, OH 45879 and is currently estimated at $284,455, approximately $253 per square foot. 7583 W Front St is a home located in Paulding County with nearby schools including Wayne Trace High School.
Ownership History
Date
Name
Owned For
Owner Type
Purchase Details
Closed on
Jul 16, 2019
Sold by
Bidlack Alyse Marie and Bidlack Eric A
Bought by
Bidlack Eric A and Bidlack Alyse Marie
Current Estimated Value
Purchase Details
Closed on
Apr 27, 2006
Sold by
Foy Cludine L and Youtsey Claudine L
Bought by
Ackerman Alyse Marie
Home Financials for this Owner
Home Financials are based on the most recent Mortgage that was taken out on this home.
Original Mortgage
$63,900
Outstanding Balance
$35,965
Interest Rate
6.39%
Mortgage Type
New Conventional
Estimated Equity
$248,490
Purchase Details
Closed on
May 10, 1999
Sold by
Daniels Swanson
Bought by
Ackerman Alyse Marie
Create a Home Valuation Report for This Property
The Home Valuation Report is an in-depth analysis detailing your home's value as well as a comparison with similar homes in the area
Purchase History
| Date | Buyer | Sale Price | Title Company |
|---|---|---|---|
| Bidlack Eric A | -- | None Available | |
| Ackerman Alyse Marie | $38,500 | None Available | |
| Ackerman Alyse Marie | $37,500 | -- |
Source: Public Records
Mortgage History
| Date | Status | Borrower | Loan Amount |
|---|---|---|---|
| Open | Ackerman Alyse Marie | $63,900 |
Source: Public Records
Tax History
| Year | Tax Paid | Tax Assessment Tax Assessment Total Assessment is a certain percentage of the fair market value that is determined by local assessors to be the total taxable value of land and additions on the property. | Land | Improvement |
|---|---|---|---|---|
| 2025 | $2,928 | $93,110 | $4,940 | $88,170 |
| 2024 | $2,928 | $74,490 | $3,960 | $70,530 |
| 2023 | $2,549 | $74,490 | $3,960 | $70,530 |
| 2022 | $2,538 | $74,490 | $3,960 | $70,530 |
| 2021 | $2,090 | $48,200 | $3,960 | $44,240 |
| 2020 | $1,920 | $48,200 | $3,960 | $44,240 |
| 2019 | $1,928 | $48,200 | $3,960 | $44,240 |
| 2018 | $1,780 | $48,200 | $3,960 | $44,240 |
| 2017 | $1,827 | $48,200 | $3,960 | $44,240 |
| 2016 | $1,781 | $48,200 | $3,960 | $44,240 |
| 2015 | $1,692 | $46,420 | $3,680 | $42,740 |
| 2014 | $1,712 | $46,420 | $3,680 | $42,740 |
| 2013 | $1,963 | $46,420 | $3,680 | $42,740 |
Source: Public Records
Map
Nearby Homes
- 7583 Front St (Broughton)
- 0 W Front St
- 7570 W Front St
- 7705 W Front St
- 7381 W Front St
- 7381 W Front St
- 7593 E Front St
- 7455 E Front St
- 7755 E Front St
- 7148 W Front St
- 7624 E Front St
- 14850 State Route 613
- 7162 W Front St
- 7444 E Front St
- 7069 W Front St
- 14884 State Route 613
- 7051 E Front St
- 7148 E Front St
- 14930 State Route 613
- 7909 Broughton Pike
Your Personal Tour Guide
Ask me questions while you tour the home.