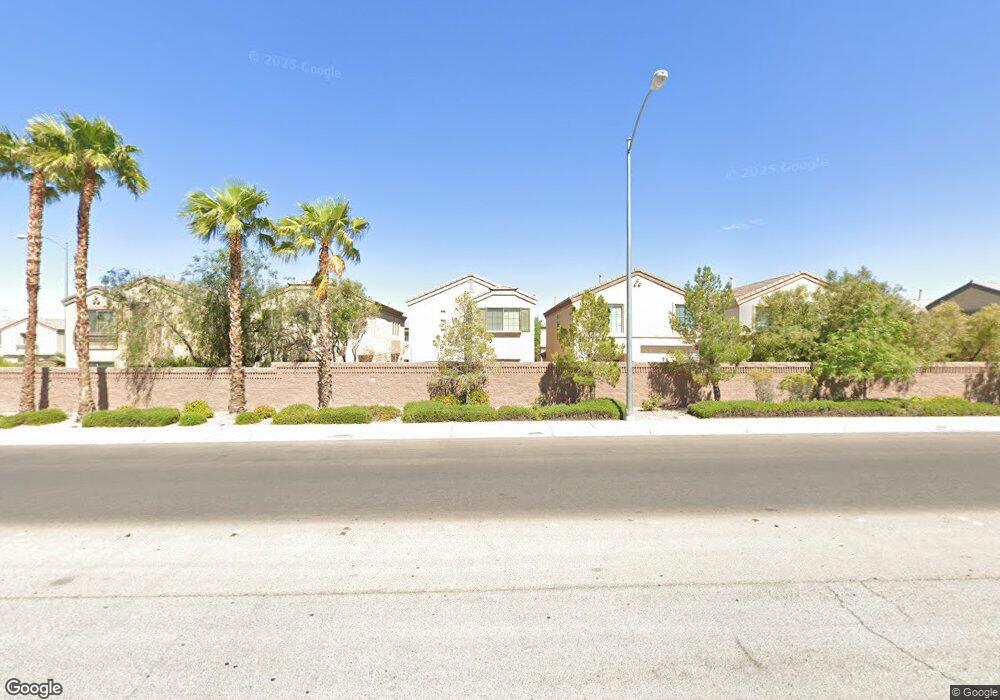
7588 Whiskey Moon St Las Vegas, NV 89139
Coronado Ranch NeighborhoodEstimated Value: $384,898 - $400,000
3
Beds
3
Baths
1,493
Sq Ft
$263/Sq Ft
Est. Value
About This Home
This home is located at 7588 Whiskey Moon St, Las Vegas, NV 89139 and is currently estimated at $393,225, approximately $263 per square foot. 7588 Whiskey Moon St is a home located in Clark County with nearby schools including Dr. Beverly S. Mathis Elementary School, Lawrence & Heidi Canarelli Middle School, and Desert Oasis High School.
Ownership History
Date
Name
Owned For
Owner Type
Purchase Details
Closed on
May 31, 2022
Sold by
Smith Jorden B and Smith Clorissa
Bought by
Dwf Vi Atlas Sfr Nv Llc
Current Estimated Value
Purchase Details
Closed on
Apr 27, 2021
Sold by
Smith Jorden and Smith Clorissa
Bought by
Smith Jorden B and Smith Clorissa
Home Financials for this Owner
Home Financials are based on the most recent Mortgage that was taken out on this home.
Original Mortgage
$272,000
Interest Rate
3%
Mortgage Type
VA
Purchase Details
Closed on
Jul 19, 2019
Sold by
Senko Brittney and Schriever Brittney
Bought by
Smith Jorden and Smith Clorissa
Home Financials for this Owner
Home Financials are based on the most recent Mortgage that was taken out on this home.
Original Mortgage
$273,745
Interest Rate
3.82%
Mortgage Type
VA
Purchase Details
Closed on
Oct 21, 2004
Sold by
Centex Homes
Bought by
Schriever Brittney
Home Financials for this Owner
Home Financials are based on the most recent Mortgage that was taken out on this home.
Original Mortgage
$179,673
Interest Rate
5.12%
Mortgage Type
Unknown
Create a Home Valuation Report for This Property
The Home Valuation Report is an in-depth analysis detailing your home's value as well as a comparison with similar homes in the area
Home Values in the Area
Average Home Value in this Area
Purchase History
| Date | Buyer | Sale Price | Title Company |
|---|---|---|---|
| Dwf Vi Atlas Sfr Nv Llc | $411,500 | First Integrity Title | |
| Smith Jorden B | -- | Fidelity National Title | |
| Smith Jorden | $265,000 | Fidelity National Title | |
| Schriever Brittney | $224,592 | Commerce Title |
Source: Public Records
Mortgage History
| Date | Status | Borrower | Loan Amount |
|---|---|---|---|
| Previous Owner | Smith Jorden B | $272,000 | |
| Previous Owner | Smith Jorden | $273,745 | |
| Previous Owner | Schriever Brittney | $179,673 | |
| Closed | Schriever Brittney | $22,450 |
Source: Public Records
Tax History Compared to Growth
Tax History
| Year | Tax Paid | Tax Assessment Tax Assessment Total Assessment is a certain percentage of the fair market value that is determined by local assessors to be the total taxable value of land and additions on the property. | Land | Improvement |
|---|---|---|---|---|
| 2025 | $1,868 | $95,510 | $31,500 | $64,010 |
| 2024 | $1,730 | $95,510 | $31,500 | $64,010 |
| 2023 | $1,730 | $89,941 | $29,750 | $60,191 |
| 2022 | $1,602 | $79,111 | $24,150 | $54,961 |
| 2021 | $1,484 | $75,315 | $23,100 | $52,215 |
| 2020 | $1,375 | $73,782 | $22,050 | $51,732 |
| 2019 | $1,289 | $70,036 | $19,250 | $50,786 |
| 2018 | $1,230 | $63,329 | $14,700 | $48,629 |
| 2017 | $1,863 | $63,536 | $14,350 | $49,186 |
| 2016 | $1,152 | $57,409 | $10,500 | $46,909 |
| 2015 | $1,149 | $52,022 | $9,800 | $42,222 |
| 2014 | $1,115 | $36,889 | $4,550 | $32,339 |
Source: Public Records
Map
Nearby Homes
- 7569 Garden Galley St
- 5481 Railroad River Ave
- 5419 Floating Flower Ave
- 5431 Hasley Canyon Ave
- 7432 Decoro St
- 7418 Granada Willows St
- 5390 Montauck Ave
- 7445 Innovation Peak Ct
- 7415 Innovation Peak Ct
- 7468 Treasure Chest St
- 7825 Bright Lodge St
- 7766 Pacific Dunes St
- 4998 Lavaliere Ave
- 7813 Westwind Rd
- 5597 Fewkes Canyon Ct
- 7881 Tyrell Peaks St
- 7534 Allon Abraham St
- 7724 Somerhill Point Way
- 7478 Coastal Ledge St
- 7819 Harp Tree St
- 7582 Whiskey Moon St
- 7594 Whiskey Moon St
- 7576 Whiskey Moon St
- 7587 Garden Galley St
- 7593 Garden Galley St
- 7570 Whiskey Moon St
- 7581 Garden Galley St Unit none
- 7581 Garden Galley St
- 7575 Garden Galley St
- 7564 Whiskey Moon St
- 7583 Whiskey Moon St
- 7583 Whiskey Moon St Unit none
- 126 I-515
- 7589 Whiskey Moon St
- 7577 Whiskey Moon St
- 5467 Railroad River Ave
- 5459 Railroad River Ave
- 5459 Railroad River Ave
- 7595 Whiskey Moon St
- 7571 Whiskey Moon St