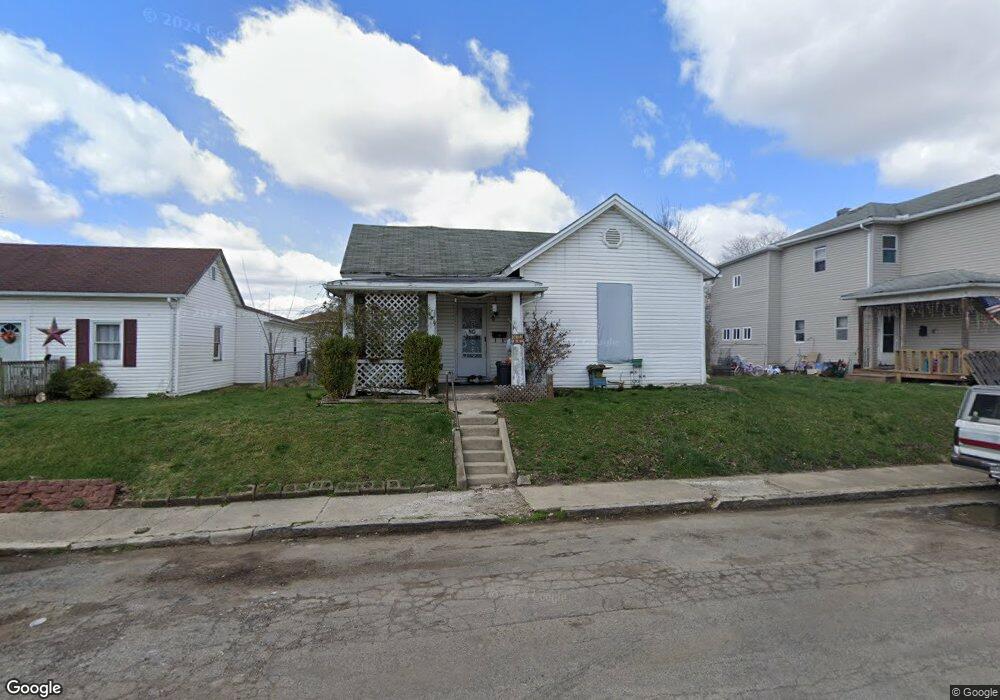
759 Farlow St Springfield, OH 45503
Estimated Value: $72,373 - $100,000
2
Beds
1
Bath
934
Sq Ft
$88/Sq Ft
Est. Value
About This Home
This home is located at 759 Farlow St, Springfield, OH 45503 and is currently estimated at $82,093, approximately $87 per square foot. 759 Farlow St is a home located in Clark County with nearby schools including Lagonda Elementary School, Schaefer Middle School, and Springfield High School.
Ownership History
Date
Name
Owned For
Owner Type
Purchase Details
Closed on
Oct 19, 2020
Sold by
Mckenna Bruce E and Mckenna Dana A
Bought by
Silvers Marguerite
Current Estimated Value
Purchase Details
Closed on
Jun 6, 2012
Sold by
Mckenna Bruce L and Mckenna Dana A
Bought by
Silvers Marguerite
Home Financials for this Owner
Home Financials are based on the most recent Mortgage that was taken out on this home.
Original Mortgage
$32,310
Interest Rate
3.9%
Mortgage Type
Seller Take Back
Purchase Details
Closed on
Nov 4, 2000
Sold by
Zugelder John L and Zugelder Frieda R
Bought by
Mckenna Bruce E and Mckenna Dana Ann
Home Financials for this Owner
Home Financials are based on the most recent Mortgage that was taken out on this home.
Original Mortgage
$15,000
Interest Rate
8%
Mortgage Type
Seller Take Back
Purchase Details
Closed on
Apr 12, 1995
Sold by
Jacks Sandra A
Bought by
Mckenna Bruce E and Mckenna Dana
Purchase Details
Closed on
Aug 27, 1993
Create a Home Valuation Report for This Property
The Home Valuation Report is an in-depth analysis detailing your home's value as well as a comparison with similar homes in the area
Home Values in the Area
Average Home Value in this Area
Purchase History
| Date | Buyer | Sale Price | Title Company |
|---|---|---|---|
| Silvers Marguerite | $32,000 | None Available | |
| Silvers Marguerite | $32,000 | None Available | |
| Mckenna Bruce E | $20,000 | -- | |
| Mckenna Bruce E | $23,000 | -- | |
| -- | -- | -- |
Source: Public Records
Mortgage History
| Date | Status | Borrower | Loan Amount |
|---|---|---|---|
| Previous Owner | Silvers Marguerite | $32,310 | |
| Previous Owner | Mckenna Bruce E | $15,000 |
Source: Public Records
Tax History Compared to Growth
Tax History
| Year | Tax Paid | Tax Assessment Tax Assessment Total Assessment is a certain percentage of the fair market value that is determined by local assessors to be the total taxable value of land and additions on the property. | Land | Improvement |
|---|---|---|---|---|
| 2024 | $2,865 | $11,450 | $2,650 | $8,800 |
| 2023 | $1,560 | $11,450 | $2,650 | $8,800 |
| 2022 | $1,496 | $11,450 | $2,650 | $8,800 |
| 2021 | $512 | $9,320 | $2,120 | $7,200 |
| 2020 | $513 | $9,320 | $2,120 | $7,200 |
| 2019 | $515 | $9,320 | $2,120 | $7,200 |
| 2018 | $444 | $7,720 | $2,120 | $5,600 |
| 2017 | $444 | $7,718 | $2,118 | $5,600 |
| 2016 | $444 | $7,718 | $2,118 | $5,600 |
| 2015 | $484 | $8,247 | $2,118 | $6,129 |
| 2014 | $482 | $8,247 | $2,118 | $6,129 |
| 2013 | $477 | $8,247 | $2,118 | $6,129 |
Source: Public Records
Map
Nearby Homes
- 1030 Sherman Ave Unit 1032
- 718 N Florence St
- 803 Laurel St
- 1568 Lagonda Ave
- 1105 Farlow St
- 1634 Edwards Ave
- 1020 Jasper St
- 836-838 Rodgers Dr
- 1621 Prospect St
- 726 E Madison Ave
- 1782 Edwards Ave
- 1783 Edwards Ave
- 0 Mitchell Blvd
- 1721 Prospect St
- 1815 Edwards Ave
- 955 Avondale Ave
- 1624 Highland Ave
- 820 Olive St Unit 822
- 557 E Cassilly St Unit 559
- 753 Farlow St
- 763 Farlow St
- 767 Farlow St
- 1048 Thrasher St
- 739 Farlow St
- 773 Farlow St
- 733 Farlow St
- 777 Farlow St
- 1036 Thrasher St
- 774 Woodbine Ave
- 1047 Thrasher St
- 776 Woodbine Ave
- 781 Farlow St Unit 783
- 725 Farlow St
- 1041 Thrasher St
- 780 Woodbine Ave
- 723 Farlow St
- 1030 Thrasher St
- 1037 Thrasher St
- 787 Farlow St