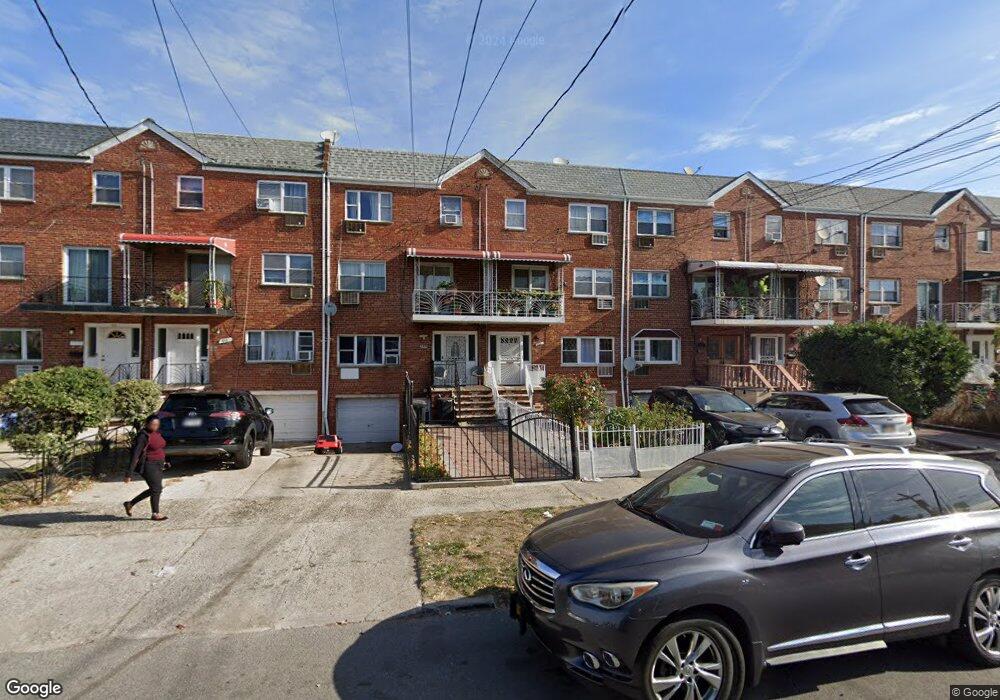
759 Remsen Ave Brooklyn, NY 11236
East Flatbush NeighborhoodEstimated Value: $741,000 - $920,000
--
Bed
--
Bath
3,450
Sq Ft
$246/Sq Ft
Est. Value
About This Home
This home is located at 759 Remsen Ave, Brooklyn, NY 11236 and is currently estimated at $847,333, approximately $245 per square foot. 759 Remsen Ave is a home located in Kings County with nearby schools including P.S. 233 The Langston Hughes School, I.S. 285 Meyer Levin, and New American Academy Charter School.
Ownership History
Date
Name
Owned For
Owner Type
Purchase Details
Closed on
Aug 6, 2020
Sold by
Baird Ashford and Mccammon Baird Roxanne
Bought by
Baird Ashford and Mccammon Baird Roxanne
Current Estimated Value
Purchase Details
Closed on
Jan 25, 1996
Sold by
Kaminsky Henry
Bought by
Mccammon Minerva and Mccammon Roxanne
Home Financials for this Owner
Home Financials are based on the most recent Mortgage that was taken out on this home.
Original Mortgage
$209,700
Outstanding Balance
$7,127
Interest Rate
7.4%
Estimated Equity
$840,206
Create a Home Valuation Report for This Property
The Home Valuation Report is an in-depth analysis detailing your home's value as well as a comparison with similar homes in the area
Home Values in the Area
Average Home Value in this Area
Purchase History
| Date | Buyer | Sale Price | Title Company |
|---|---|---|---|
| Baird Ashford | -- | -- | |
| Mccammon Minerva | $233,000 | -- |
Source: Public Records
Mortgage History
| Date | Status | Borrower | Loan Amount |
|---|---|---|---|
| Open | Mccammon Minerva | $209,700 |
Source: Public Records
Tax History Compared to Growth
Tax History
| Year | Tax Paid | Tax Assessment Tax Assessment Total Assessment is a certain percentage of the fair market value that is determined by local assessors to be the total taxable value of land and additions on the property. | Land | Improvement |
|---|---|---|---|---|
| 2025 | $9,388 | $59,760 | $18,780 | $40,980 |
| 2024 | $9,388 | $58,800 | $18,780 | $40,020 |
| 2023 | $9,177 | $61,860 | $18,780 | $43,080 |
| 2022 | $8,583 | $54,660 | $18,780 | $35,880 |
| 2021 | $9,049 | $51,480 | $18,780 | $32,700 |
| 2020 | $6,786 | $49,380 | $18,780 | $30,600 |
| 2019 | $8,148 | $40,200 | $18,780 | $21,420 |
| 2018 | $7,676 | $37,656 | $16,838 | $20,818 |
| 2017 | $7,304 | $35,830 | $17,944 | $17,886 |
| 2016 | $7,163 | $35,830 | $17,280 | $18,550 |
| 2015 | $3,857 | $34,407 | $20,433 | $13,974 |
| 2014 | $3,857 | $32,460 | $20,880 | $11,580 |
Source: Public Records
Map
Nearby Homes