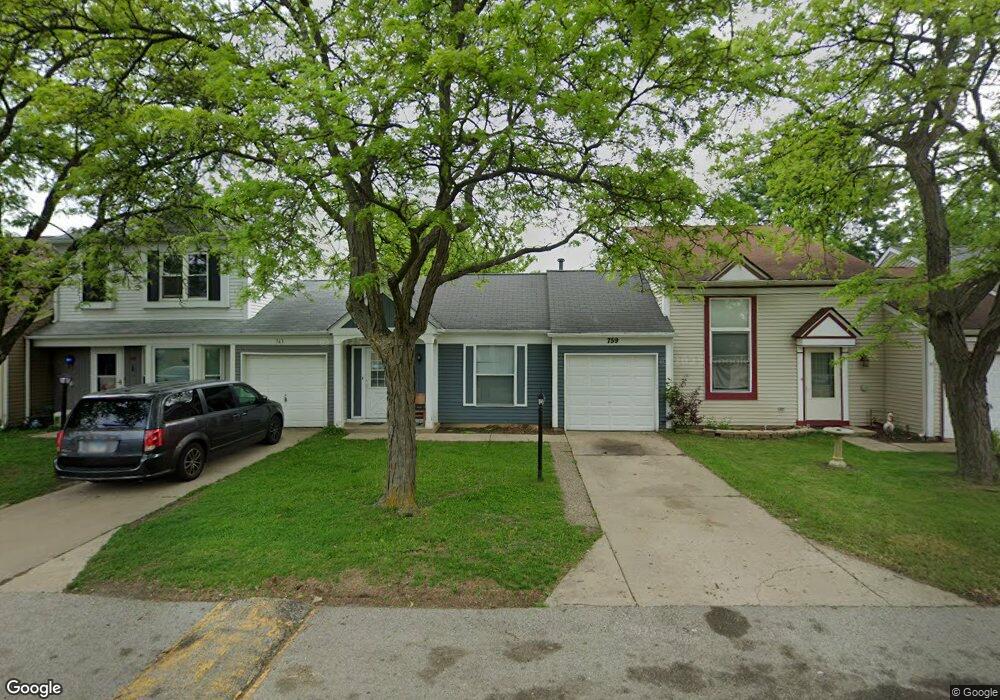
759 Taft Cir Hanover Park, IL 60133
Estimated Value: $193,000 - $210,000
1
Bed
1
Bath
640
Sq Ft
$319/Sq Ft
Est. Value
About This Home
This home is located at 759 Taft Cir, Hanover Park, IL 60133 and is currently estimated at $204,343, approximately $319 per square foot. 759 Taft Cir is a home located in Cook County with nearby schools including Anne Fox Elementary School, Jane Addams Junior High School, and Schaumburg High School.
Ownership History
Date
Name
Owned For
Owner Type
Purchase Details
Closed on
Jul 20, 2005
Sold by
Thakkar Jaswantlal and Thakkar Kokila J
Bought by
Lasalle Bank Na and Trust #134529
Current Estimated Value
Purchase Details
Closed on
Jan 19, 2005
Sold by
Chicago Title Land Trust Co
Bought by
Renteria Julio
Home Financials for this Owner
Home Financials are based on the most recent Mortgage that was taken out on this home.
Original Mortgage
$113,600
Interest Rate
6.46%
Mortgage Type
New Conventional
Purchase Details
Closed on
Jan 14, 2002
Sold by
Trush Ellyn J
Bought by
Thakkar Jaswantlal and Thakkar Kokila J
Home Financials for this Owner
Home Financials are based on the most recent Mortgage that was taken out on this home.
Original Mortgage
$74,400
Interest Rate
7.24%
Mortgage Type
Purchase Money Mortgage
Create a Home Valuation Report for This Property
The Home Valuation Report is an in-depth analysis detailing your home's value as well as a comparison with similar homes in the area
Home Values in the Area
Average Home Value in this Area
Purchase History
| Date | Buyer | Sale Price | Title Company |
|---|---|---|---|
| Lasalle Bank Na | $139,000 | Rtc | |
| Renteria Julio | $142,000 | Rtc | |
| Thakkar Jaswantlal | $95,000 | Fox Title Company |
Source: Public Records
Mortgage History
| Date | Status | Borrower | Loan Amount |
|---|---|---|---|
| Previous Owner | Renteria Julio | $113,600 | |
| Previous Owner | Thakkar Jaswantlal | $74,400 |
Source: Public Records
Tax History
| Year | Tax Paid | Tax Assessment Tax Assessment Total Assessment is a certain percentage of the fair market value that is determined by local assessors to be the total taxable value of land and additions on the property. | Land | Improvement |
|---|---|---|---|---|
| 2025 | $4,463 | $19,000 | $4,320 | $14,680 |
| 2024 | $4,463 | $14,000 | $3,000 | $11,000 |
| 2023 | $3,271 | $14,000 | $3,000 | $11,000 |
| 2022 | $3,271 | $14,000 | $3,000 | $11,000 |
| 2021 | $2,368 | $9,988 | $3,915 | $6,073 |
| 2020 | $2,415 | $9,988 | $3,915 | $6,073 |
| 2019 | $2,460 | $11,223 | $3,915 | $7,308 |
| 2018 | $2,511 | $10,486 | $3,307 | $7,179 |
| 2017 | $2,491 | $10,486 | $3,307 | $7,179 |
| 2016 | $2,630 | $10,486 | $3,307 | $7,179 |
| 2015 | $1,558 | $6,991 | $2,767 | $4,224 |
| 2014 | $1,549 | $6,991 | $2,767 | $4,224 |
| 2013 | $1,482 | $6,991 | $2,767 | $4,224 |
Source: Public Records
Map
Nearby Homes
- 7487 Northway Dr
- 7605 Manchester Manor
- 7594 Sarson Way
- 728 Haddam Way
- 7407 Coventry Dr
- 7388 Coventry Ln
- 7583 Waterford Dr
- 7468 Filmore Ave
- 7214 Farmstead Ln
- 717 Slingerland Dr
- 1115 Old Mill Ln
- 7604 Cumberland Dr
- 7211 Longmeadow Ln
- 7873 Asbury Cir S
- 7315 Cumberland Dr
- 7609 Bristol Ln Unit D
- 1846 Keystone Place Unit 49
- 7784 Huntington Cir S
- 511 S Walnut Ln
- 7557 Bristol Ln Unit 1
Your Personal Tour Guide
Ask me questions while you tour the home.