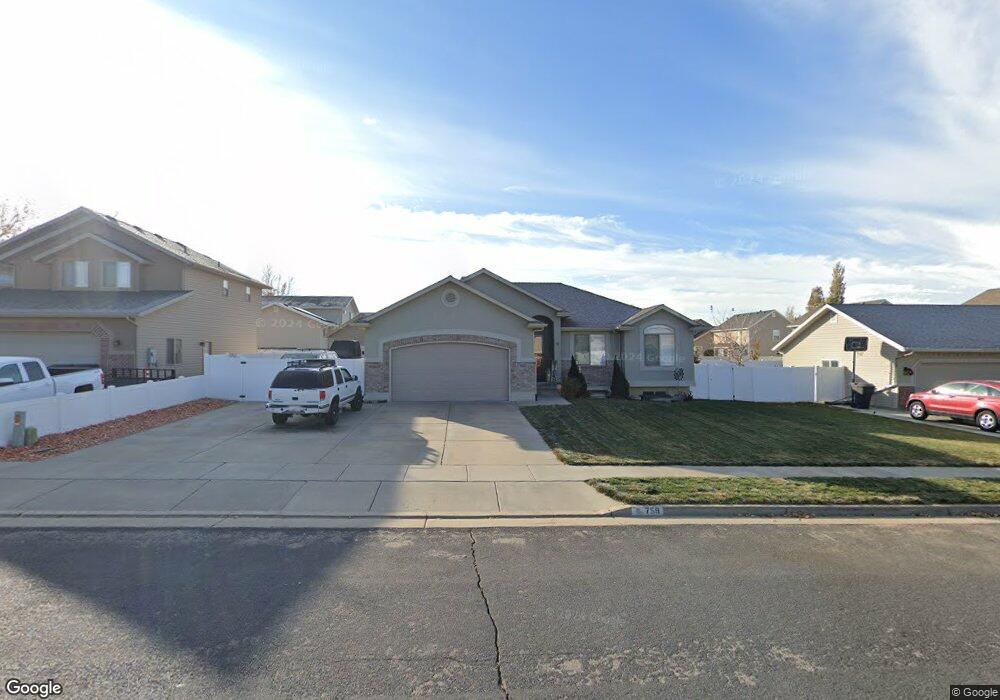
759 W 1090 N Clearfield, UT 84015
Estimated Value: $505,000 - $512,000
3
Beds
2
Baths
2,718
Sq Ft
$188/Sq Ft
Est. Value
About This Home
This home is located at 759 W 1090 N, Clearfield, UT 84015 and is currently estimated at $510,196, approximately $187 per square foot. 759 W 1090 N is a home located in Davis County with nearby schools including Clinton Elementary School, Sunset Junior High School, and Clearfield High School.
Ownership History
Date
Name
Owned For
Owner Type
Purchase Details
Closed on
Jul 30, 2013
Sold by
Kimber Matthew L
Bought by
Aaron William P and Aaron Sheila A
Current Estimated Value
Home Financials for this Owner
Home Financials are based on the most recent Mortgage that was taken out on this home.
Original Mortgage
$232,215
Outstanding Balance
$172,022
Interest Rate
4.37%
Mortgage Type
FHA
Estimated Equity
$338,174
Purchase Details
Closed on
Sep 23, 2010
Sold by
Kimber Matthew L
Bought by
Kimber Matthew L
Home Financials for this Owner
Home Financials are based on the most recent Mortgage that was taken out on this home.
Original Mortgage
$198,990
Interest Rate
4.38%
Mortgage Type
VA
Purchase Details
Closed on
Jun 28, 2006
Sold by
Wind River Homes Inc
Bought by
Kimber Matthew L
Home Financials for this Owner
Home Financials are based on the most recent Mortgage that was taken out on this home.
Original Mortgage
$204,300
Interest Rate
6.57%
Mortgage Type
VA
Purchase Details
Closed on
Jan 19, 2006
Sold by
Freemont Investments Llc
Bought by
Wind River Homes Inc
Home Financials for this Owner
Home Financials are based on the most recent Mortgage that was taken out on this home.
Original Mortgage
$168,300
Interest Rate
6.28%
Mortgage Type
Purchase Money Mortgage
Purchase Details
Closed on
Jan 16, 2004
Sold by
Faerber David M
Bought by
Freemont Investments Llc
Home Financials for this Owner
Home Financials are based on the most recent Mortgage that was taken out on this home.
Original Mortgage
$200,000
Interest Rate
5.86%
Mortgage Type
Stand Alone Second
Purchase Details
Closed on
Jan 7, 2004
Sold by
Keepsake Development Llc
Bought by
Faerber David M and Vansweden James O
Home Financials for this Owner
Home Financials are based on the most recent Mortgage that was taken out on this home.
Original Mortgage
$200,000
Interest Rate
5.86%
Mortgage Type
Stand Alone Second
Create a Home Valuation Report for This Property
The Home Valuation Report is an in-depth analysis detailing your home's value as well as a comparison with similar homes in the area
Home Values in the Area
Average Home Value in this Area
Purchase History
| Date | Buyer | Sale Price | Title Company |
|---|---|---|---|
| Aaron William P | -- | None Available | |
| Kimber Matthew L | -- | Bonneville Superior Title | |
| Kimber Matthew L | -- | Bonneville Superior Title Co | |
| Wind River Homes Inc | -- | Bonneville Title Company | |
| Freemont Investments Llc | -- | Bonneville Title Company Inc | |
| Freemont Investments Llc | -- | Bonneville Title Company Inc | |
| Faerber David M | -- | Bonneville Title Company Inc |
Source: Public Records
Mortgage History
| Date | Status | Borrower | Loan Amount |
|---|---|---|---|
| Open | Aaron William P | $232,215 | |
| Previous Owner | Kimber Matthew L | $198,990 | |
| Previous Owner | Kimber Matthew L | $204,300 | |
| Previous Owner | Wind River Homes Inc | $168,300 | |
| Previous Owner | Freemont Investments Llc | $200,000 | |
| Previous Owner | Faerber David M | $900,000 |
Source: Public Records
Tax History
| Year | Tax Paid | Tax Assessment Tax Assessment Total Assessment is a certain percentage of the fair market value that is determined by local assessors to be the total taxable value of land and additions on the property. | Land | Improvement |
|---|---|---|---|---|
| 2025 | $2,683 | $257,950 | $88,773 | $169,177 |
| 2024 | $2,572 | $248,600 | $97,742 | $150,858 |
| 2023 | $2,421 | $433,000 | $110,923 | $322,077 |
| 2022 | $2,557 | $253,000 | $68,201 | $184,799 |
| 2021 | $2,289 | $336,000 | $84,789 | $251,211 |
| 2020 | $1,990 | $289,000 | $71,735 | $217,265 |
| 2019 | $1,917 | $272,000 | $84,406 | $187,594 |
| 2018 | $1,815 | $253,000 | $71,368 | $181,632 |
| 2016 | $1,630 | $117,370 | $27,726 | $89,644 |
| 2015 | $1,743 | $119,295 | $27,726 | $91,569 |
| 2014 | $1,605 | $111,582 | $27,726 | $83,856 |
| 2013 | -- | $109,030 | $27,143 | $81,887 |
Source: Public Records
Map
Nearby Homes
Your Personal Tour Guide
Ask me questions while you tour the home.