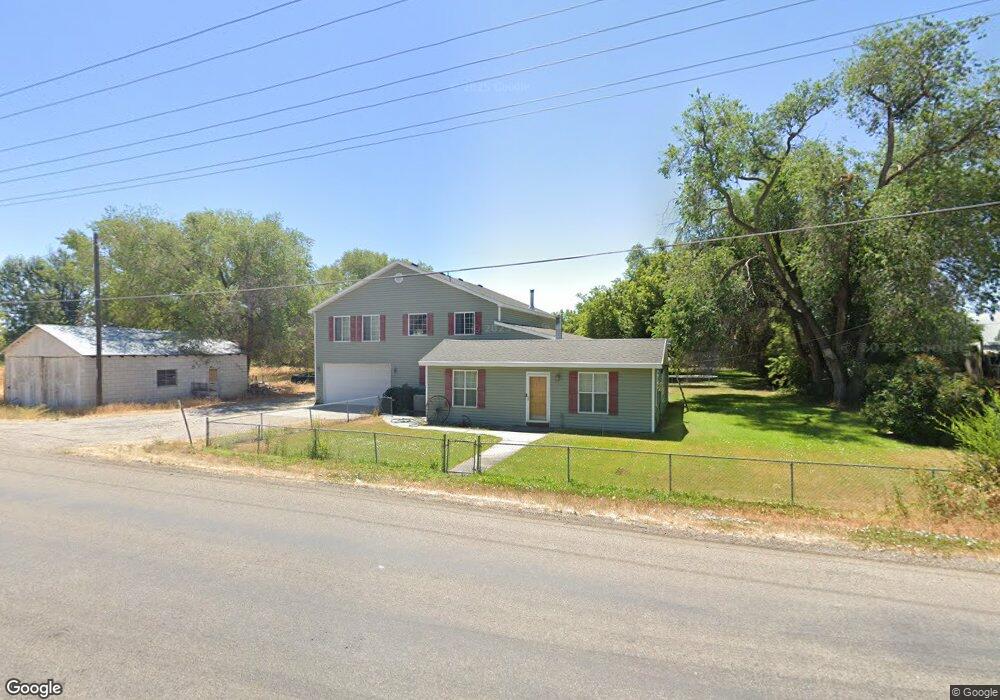
759 W 200 N Blackfoot, ID 83221
Estimated Value: $366,000 - $553,000
3
Beds
1
Bath
928
Sq Ft
$516/Sq Ft
Est. Value
About This Home
This home is located at 759 W 200 N, Blackfoot, ID 83221 and is currently estimated at $478,753, approximately $515 per square foot. 759 W 200 N is a home located in Bingham County with nearby schools including Moreland Elementary School, Riverside Elementary School, and Rockford Elementary School.
Ownership History
Date
Name
Owned For
Owner Type
Purchase Details
Closed on
Nov 13, 2025
Sold by
Cagle Mathew B and Cagle Corrie L
Bought by
Stewart Adam
Current Estimated Value
Purchase Details
Closed on
Jul 2, 2006
Sold by
Cagle Mathew and Cagle Corrie
Bought by
Cagle Mathew B and Cagle Corrie L
Home Financials for this Owner
Home Financials are based on the most recent Mortgage that was taken out on this home.
Original Mortgage
$230,400
Interest Rate
6.57%
Mortgage Type
Construction
Create a Home Valuation Report for This Property
The Home Valuation Report is an in-depth analysis detailing your home's value as well as a comparison with similar homes in the area
Home Values in the Area
Average Home Value in this Area
Purchase History
| Date | Buyer | Sale Price | Title Company |
|---|---|---|---|
| Stewart Adam | -- | Flying S Title And Escrow | |
| Cagle Mathew B | -- | -- |
Source: Public Records
Mortgage History
| Date | Status | Borrower | Loan Amount |
|---|---|---|---|
| Previous Owner | Cagle Mathew B | $230,400 |
Source: Public Records
Tax History Compared to Growth
Tax History
| Year | Tax Paid | Tax Assessment Tax Assessment Total Assessment is a certain percentage of the fair market value that is determined by local assessors to be the total taxable value of land and additions on the property. | Land | Improvement |
|---|---|---|---|---|
| 2025 | $1,696 | $470,007 | $89,200 | $380,807 |
| 2024 | $1,696 | $447,327 | $66,520 | $380,807 |
| 2023 | $1,613 | $447,327 | $66,520 | $380,807 |
| 2022 | $3,462 | $372,917 | $60,600 | $312,317 |
| 2021 | $2,393 | $324,310 | $52,600 | $271,710 |
| 2020 | $1,967 | $247,900 | $0 | $0 |
| 2019 | $2,116 | $247,900 | $0 | $0 |
| 2018 | $2,278 | $247,900 | $36,800 | $211,100 |
| 2017 | $2,213 | $240,100 | $29,000 | $211,100 |
| 2016 | $2,283 | $240,100 | $0 | $0 |
| 2015 | -- | $240,100 | $0 | $0 |
Source: Public Records
Map
Nearby Homes