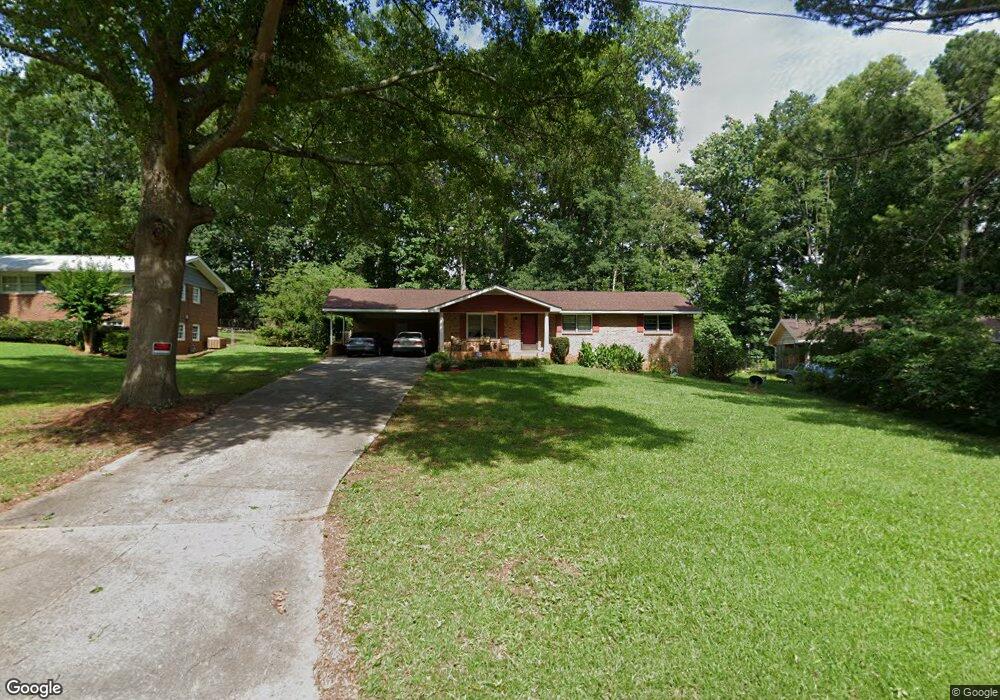
7590 Howell Ln Unit 9 Riverdale, GA 30296
Estimated Value: $183,851 - $319,000
3
Beds
2
Baths
1,323
Sq Ft
$167/Sq Ft
Est. Value
About This Home
This home is located at 7590 Howell Ln Unit 9, Riverdale, GA 30296 and is currently estimated at $221,213, approximately $167 per square foot. 7590 Howell Ln Unit 9 is a home located in Clayton County with nearby schools including Lake Ridge Elementary School, Kendrick Middle School, and Riverdale High School.
Ownership History
Date
Name
Owned For
Owner Type
Purchase Details
Closed on
Sep 18, 2020
Sold by
Black Veronica S
Bought by
Black Veronica S and Black Salve
Current Estimated Value
Purchase Details
Closed on
May 26, 2017
Sold by
Morgan Christian
Bought by
Black Veronica S
Home Financials for this Owner
Home Financials are based on the most recent Mortgage that was taken out on this home.
Original Mortgage
$78,551
Interest Rate
4.37%
Mortgage Type
FHA
Purchase Details
Closed on
Jun 5, 2013
Sold by
Othello Holdings Llc
Bought by
Morgan Christian
Home Financials for this Owner
Home Financials are based on the most recent Mortgage that was taken out on this home.
Original Mortgage
$39,920
Interest Rate
3.42%
Mortgage Type
New Conventional
Purchase Details
Closed on
Jun 30, 2008
Sold by
Friedman Benjamin
Bought by
Othello Holdings Llc
Purchase Details
Closed on
May 22, 2008
Sold by
Hsbc Bank Usa Na
Bought by
Friedman Benjamin
Purchase Details
Closed on
Jan 2, 2008
Sold by
Bell Leon
Bought by
Hsbc Bank Usa Na
Create a Home Valuation Report for This Property
The Home Valuation Report is an in-depth analysis detailing your home's value as well as a comparison with similar homes in the area
Home Values in the Area
Average Home Value in this Area
Purchase History
| Date | Buyer | Sale Price | Title Company |
|---|---|---|---|
| Black Veronica S | -- | -- | |
| Black Veronica S | $80,000 | -- | |
| Morgan Christian | $49,900 | -- | |
| Othello Holdings Llc | -- | -- | |
| Friedman Benjamin | $43,000 | -- | |
| Hsbc Bank Usa Na | $69,665 | -- |
Source: Public Records
Mortgage History
| Date | Status | Borrower | Loan Amount |
|---|---|---|---|
| Previous Owner | Black Veronica S | $78,551 | |
| Previous Owner | Morgan Christian | $39,920 |
Source: Public Records
Tax History Compared to Growth
Tax History
| Year | Tax Paid | Tax Assessment Tax Assessment Total Assessment is a certain percentage of the fair market value that is determined by local assessors to be the total taxable value of land and additions on the property. | Land | Improvement |
|---|---|---|---|---|
| 2024 | $1,334 | $44,200 | $7,200 | $37,000 |
| 2023 | $1,456 | $40,320 | $7,200 | $33,120 |
| 2022 | $1,144 | $39,160 | $7,200 | $31,960 |
| 2021 | $1,090 | $37,600 | $7,200 | $30,400 |
| 2020 | $942 | $33,557 | $7,200 | $26,357 |
| 2019 | $766 | $28,878 | $6,400 | $22,478 |
| 2018 | $661 | $26,280 | $6,400 | $19,880 |
| 2017 | $845 | $20,764 | $6,400 | $14,364 |
| 2016 | $854 | $20,982 | $6,400 | $14,582 |
| 2015 | $848 | $0 | $0 | $0 |
| 2014 | $794 | $19,960 | $6,400 | $13,560 |
Source: Public Records
Map
Nearby Homes
- 828 Commerce Blvd
- 785 Commerce Blvd
- 7740 Briar Forest Ln
- 7617 Lakemoor Dr
- 0 Sugarcreek Way Unit 10572882
- 0 Sugarcreek Way Unit 7622149
- 955 Loch Forest Way
- 7737 Bar Harbor Dr
- 1124 E Briar Gate Ct
- 838 Cormac Dr
- 634 Shadowmoore Dr
- 7563 Winderemere Park
- 623 Shadowmoore Dr
- 7340 Chalk Way
- 7356 Caribou Trail
- 510 Olde Rose Ct Unit 1
- 7280 Fernwood Dr Unit 4
- 7438 Chilton Ln
- 7748 Bernardo Dr
- 7590 Howell Ln
- 7580 Howell Ln
- 7598 Howell Ln
- 7602 Howell Ln
- 7570 Howell Ln
- 7585 Howell Ln
- 7616 Howell Ln
- 7601 Howell Ln
- 7575 Howell Ln
- 7651 Commerce Ct
- 7653 Commerce Ct
- 7655 Commerce Ct
- 7657 Commerce Ct
- 7649 Commerce Ct
- 7659 Commerce Ct
- 7560 Howell Ln
- 7661 Commerce Ct
- 7661 Commerce Ct Unit 72
- 7647 Commerce Ct
- 7645 Commerce Ct