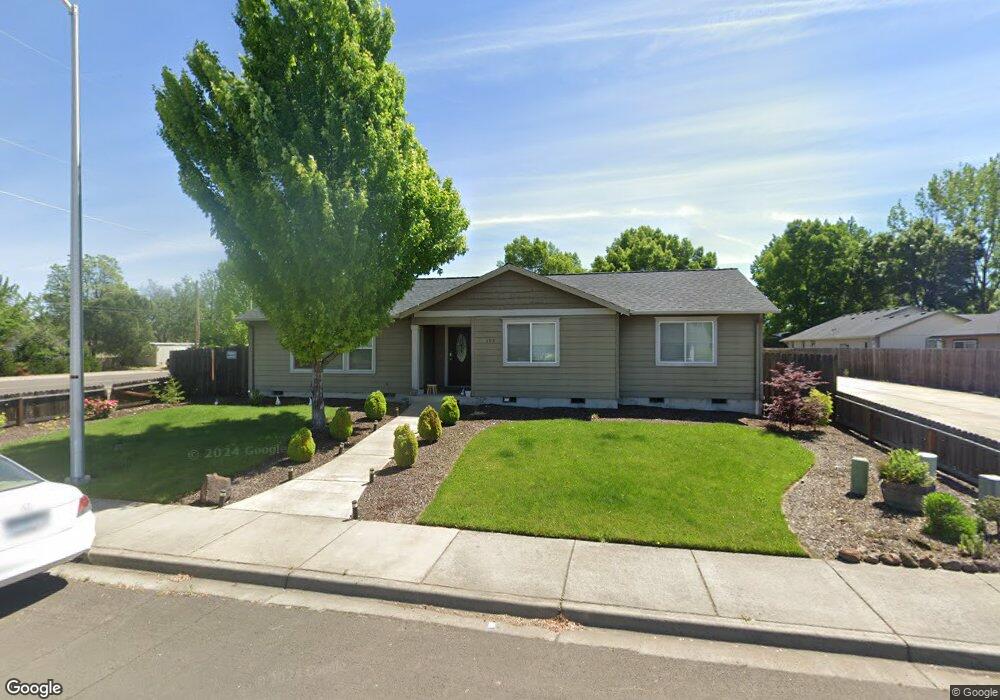
7593 Twenty Eighth St White City, OR 97503
Estimated Value: $370,000 - $387,000
3
Beds
2
Baths
1,408
Sq Ft
$268/Sq Ft
Est. Value
About This Home
This home is located at 7593 Twenty Eighth St, White City, OR 97503 and is currently estimated at $377,000, approximately $267 per square foot. 7593 Twenty Eighth St is a home located in Jackson County with nearby schools including Table Rock Elementary School, White Mountain Middle School, and Eagle Point Middle School.
Ownership History
Date
Name
Owned For
Owner Type
Purchase Details
Closed on
Dec 5, 2018
Sold by
Saavedra Hernan Torres
Bought by
Fletes Monica and Fletes Elkigio E
Current Estimated Value
Home Financials for this Owner
Home Financials are based on the most recent Mortgage that was taken out on this home.
Original Mortgage
$250,505
Outstanding Balance
$220,700
Interest Rate
4.8%
Mortgage Type
New Conventional
Estimated Equity
$156,300
Purchase Details
Closed on
Mar 27, 2013
Sold by
Horton Homes Inc
Bought by
Saavedra Hernan Torres
Home Financials for this Owner
Home Financials are based on the most recent Mortgage that was taken out on this home.
Original Mortgage
$157,003
Interest Rate
3.49%
Mortgage Type
FHA
Purchase Details
Closed on
Aug 2, 2012
Sold by
Malone Robert W
Bought by
Horton Homes Inc
Create a Home Valuation Report for This Property
The Home Valuation Report is an in-depth analysis detailing your home's value as well as a comparison with similar homes in the area
Home Values in the Area
Average Home Value in this Area
Purchase History
| Date | Buyer | Sale Price | Title Company |
|---|---|---|---|
| Fletes Monica | $248,000 | Ticor Title Co Of Orgon | |
| Saavedra Hernan Torres | $159,900 | Ticor Title Company Oregon | |
| Horton Homes Inc | $26,500 | First American |
Source: Public Records
Mortgage History
| Date | Status | Borrower | Loan Amount |
|---|---|---|---|
| Open | Fletes Monica | $250,505 | |
| Previous Owner | Saavedra Hernan Torres | $157,003 |
Source: Public Records
Tax History Compared to Growth
Tax History
| Year | Tax Paid | Tax Assessment Tax Assessment Total Assessment is a certain percentage of the fair market value that is determined by local assessors to be the total taxable value of land and additions on the property. | Land | Improvement |
|---|---|---|---|---|
| 2025 | $2,489 | $179,740 | $63,870 | $115,870 |
| 2024 | $2,489 | $174,510 | $62,010 | $112,500 |
| 2023 | $2,405 | $169,430 | $60,200 | $109,230 |
| 2022 | $2,339 | $169,430 | $60,200 | $109,230 |
| 2021 | $2,270 | $164,500 | $58,450 | $106,050 |
| 2020 | $2,409 | $159,710 | $56,740 | $102,970 |
| 2019 | $2,372 | $150,550 | $53,480 | $97,070 |
| 2018 | $2,315 | $146,170 | $51,930 | $94,240 |
| 2017 | $2,257 | $146,170 | $51,930 | $94,240 |
| 2016 | $2,320 | $137,790 | $48,950 | $88,840 |
| 2015 | $2,392 | $137,790 | $48,950 | $88,840 |
| 2014 | $2,139 | $129,890 | $46,140 | $83,750 |
Source: Public Records
Map
Nearby Homes
- 7586 Wilson Way
- 3717 Amelia Way
- 7727 Wilson Way
- 3790 Antelope Rd
- 3432 Sonny Way
- 3420 Sonny Way
- 7837 Phaedra Ln
- 7861 Houston Loop
- 7863 Houston
- 3501 Avenue C Unit SPC 35
- 3775 Agate Meadows Ct
- 3601 Avenue C Unit SPC 30
- 3756 Agate Meadows Ct
- 7875 Houston Loop
- 3762 Agate Meadows Ct
- 7879 Houston Loop
- 7880 Phaedra Ln
- 7846 Jacqueline Way
- 7837 Jacqueline Way
- 3885 Avenue C
- 7593 28th St
- 7597 Twenty Eighth St
- 7597 28th St
- 3622 Antelope Rd
- 7575 28th St
- 7575 Twenty Eighth St
- 7583 28th St
- 7583 Twenty Eighth St
- 3585 Winter Run Dr
- 3585 Winter Run
- 7591 28th St
- 7571 Twenty-Eighth St
- 7571 Twenty Eighth St
- 7571 28th St
- 7579 28th St
- 3579 Winter Run Dr
- 3637 Amelia Way
- 3573 Winter Run
- 3573 Winter Run Dr
- 3567 Winter Run