Estimated Value: $622,526 - $758,000
2
Beds
2
Baths
1,160
Sq Ft
$573/Sq Ft
Est. Value
About This Home
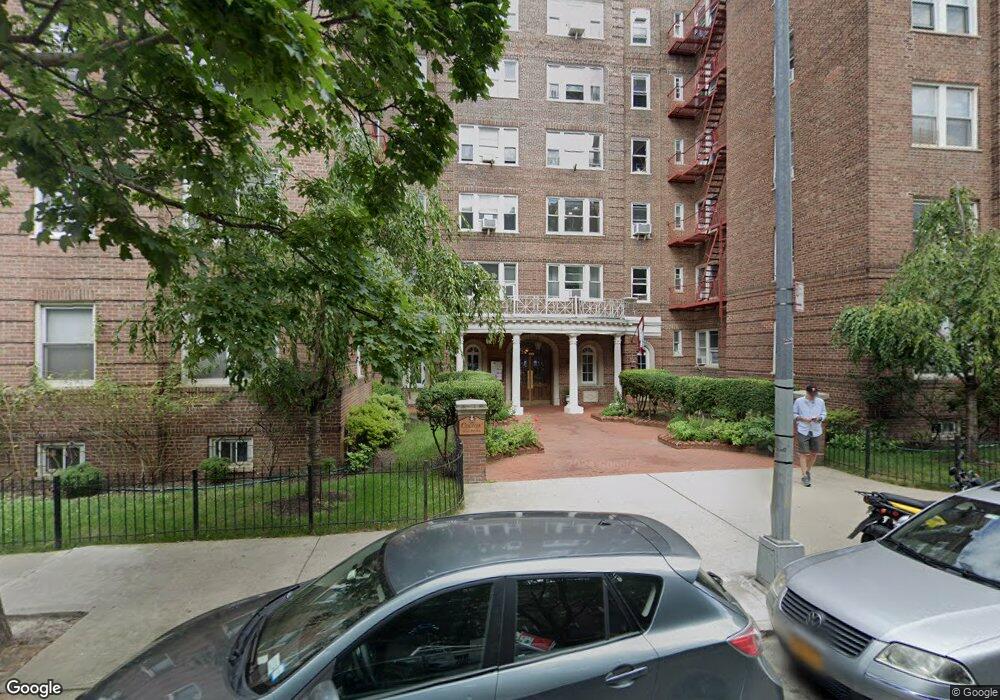
This home is located at 76-15 35 Th Ave Unit 3-E, New York City, NY 11372 and is currently estimated at $664,632, approximately $572 per square foot. 76-15 35 Th Ave Unit 3-E is a home located in Queens County with nearby schools including P.S. 212, I.S. 230, and William Cullen Bryant High School.
Ownership History
Date
Name
Owned For
Owner Type
Purchase Details
Closed on
Nov 15, 2021
Sold by
Pensco Trust Company Llc Custodian Fbo
Bought by
Pacific Premier Trust Custodian
Current Estimated Value
Purchase Details
Closed on
Oct 12, 2021
Sold by
Pensco Trust Company Llc Custodian Fbo
Bought by
Pacific Premier Trust Custodian
Purchase Details
Closed on
Apr 6, 2016
Sold by
Sung Christopher and Sung Susan
Bought by
Melrose Road Partners Llc and Pensco Trust Company
Purchase Details
Closed on
Feb 13, 2008
Sold by
Parroquin Mauricio
Bought by
Sung Christopher and Sung Susan
Home Financials for this Owner
Home Financials are based on the most recent Mortgage that was taken out on this home.
Original Mortgage
$384,000
Interest Rate
5.9%
Mortgage Type
Purchase Money Mortgage
Purchase Details
Closed on
Aug 30, 2001
Sold by
Condo Units L P
Bought by
Parroquin Mauricio
Home Financials for this Owner
Home Financials are based on the most recent Mortgage that was taken out on this home.
Original Mortgage
$166,500
Interest Rate
6.77%
Create a Home Valuation Report for This Property
The Home Valuation Report is an in-depth analysis detailing your home's value as well as a comparison with similar homes in the area
Home Values in the Area
Average Home Value in this Area
Purchase History
| Date | Buyer | Sale Price | Title Company |
|---|---|---|---|
| Pacific Premier Trust Custodian | -- | -- | |
| Pacific Premier Trust Custodian | -- | -- | |
| Melrose Road Partners Llc | $720,000 | -- | |
| Sung Christopher | $480,000 | -- | |
| Parroquin Mauricio | -- | -- |
Source: Public Records
Mortgage History
| Date | Status | Borrower | Loan Amount |
|---|---|---|---|
| Previous Owner | Sung Christopher | $384,000 | |
| Previous Owner | Parroquin Mauricio | $166,500 |
Source: Public Records
Tax History Compared to Growth
Tax History
| Year | Tax Paid | Tax Assessment Tax Assessment Total Assessment is a certain percentage of the fair market value that is determined by local assessors to be the total taxable value of land and additions on the property. | Land | Improvement |
|---|---|---|---|---|
| 2025 | $5,286 | $42,849 | $6,741 | $36,108 |
| 2024 | $5,286 | $42,283 | $6,741 | $35,542 |
| 2023 | $5,115 | $40,914 | $6,741 | $34,173 |
| 2022 | $4,990 | $40,886 | $6,741 | $34,145 |
| 2021 | $4,912 | $40,040 | $6,741 | $33,299 |
| 2020 | $5,206 | $47,005 | $6,741 | $40,264 |
| 2019 | $4,959 | $45,549 | $6,741 | $38,808 |
| 2018 | $4,670 | $36,714 | $6,740 | $29,974 |
| 2017 | $4,295 | $33,766 | $6,740 | $27,026 |
| 2016 | $4,075 | $33,766 | $6,740 | $27,026 |
| 2015 | $2,456 | $31,116 | $6,740 | $24,376 |
| 2014 | $2,456 | $30,136 | $6,741 | $23,395 |
Source: Public Records
About This Building
Map
Nearby Homes
- 76-15 35th Ave Unit 1R
- 76-12 35th Ave Unit 6J
- 77-11 35th Ave Unit 3P
- 3513 76th St Unit 51
- 77-12 35th Ave Unit A24
- 3525 77th St Unit A16
- 35-25 77th St Unit B51
- 35-25 77th St Unit B53
- 35-25 77th St Unit B44
- 34-40 78th St Unit 1B
- 35-35 75th Street Apartment 127 St Unit 127
- 35-27 76th St Unit 21
- 34-30 78th St Unit 2B
- 34-41 78th St Unit 5E
- 76-10 34th Ave Unit 2H
- 76-10 34th Ave Unit 2M
- 34-20 78th St Unit 2J
- 34-20 78th St Unit 2F
- 35-15 78th St Unit 21
- 35-24 78th St Unit A49
- 76-15 35th Ave Unit 5M
- 76-15 35th Ave Unit 6 J
- 76-15 35th Ave Unit 1H
- 76-15 35th Ave Unit 2E
- 76-15 35th Ave Unit 1M
- 76-15 35th Ave Unit 6O
- 76-15 35th Ave Unit 3L
- 76-15 35th Ave Unit 4M
- 76-15 35 Th Ave Unit 4 E
- 76-15 35th Ave Unit 2k
- 76-15 35 Th Ave Unit 3 L
- 76-15 35 Th Ave Unit 3 A
- 76-15 35th Ave Unit 4E
- 76-15 35 Th Ave Unit 4 M
- 76-15 35th Ave Unit 2O
- 76-15 35th Ave Unit 2 L
- 76-15 35 Th Ave Unit E-3
- 76-15 35 Th Ave Unit 6-E
- 76-15 35 Th Ave Unit 4-R