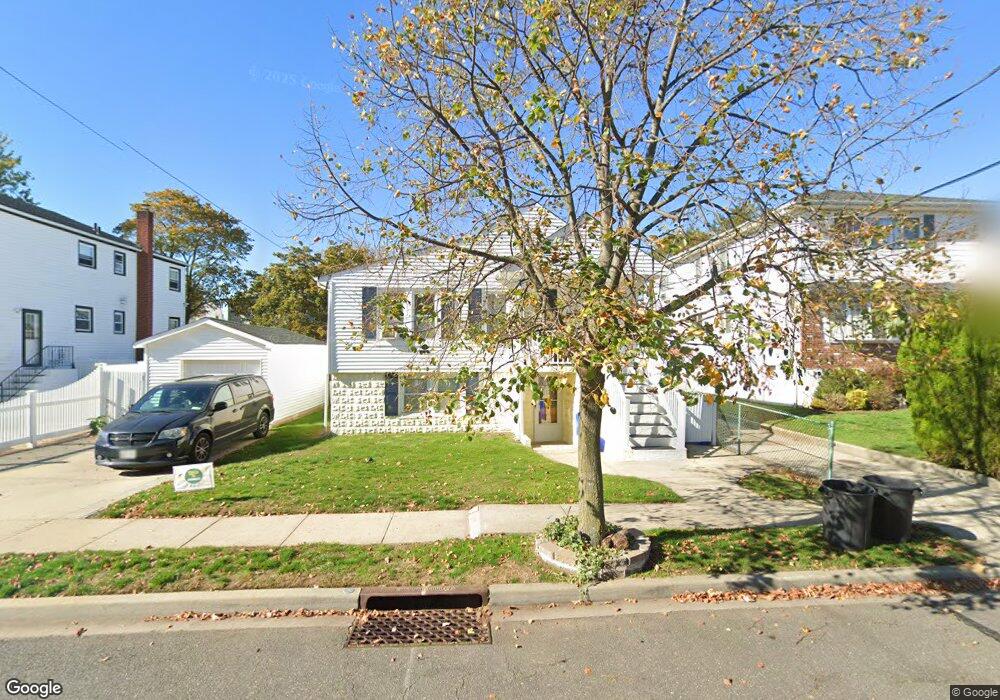
76 2nd Ave Unit Lower East Rockaway, NY 11518
Estimated Value: $676,000 - $736,764
3
Beds
1
Bath
1,071
Sq Ft
$660/Sq Ft
Est. Value
About This Home
This home is located at 76 2nd Ave Unit Lower, East Rockaway, NY 11518 and is currently estimated at $706,382, approximately $659 per square foot. 76 2nd Ave Unit Lower is a home located in Nassau County with nearby schools including East Rockaway Junior/Senior High School.
Ownership History
Date
Name
Owned For
Owner Type
Purchase Details
Closed on
Jun 20, 2024
Sold by
Schwartz Steven D and Schwartz Hagit
Bought by
Schwartz Hagit
Current Estimated Value
Purchase Details
Closed on
Apr 9, 2021
Sold by
Gottlieb Andrew J
Bought by
Schwarts Steven P and Schwarts Hagit
Home Financials for this Owner
Home Financials are based on the most recent Mortgage that was taken out on this home.
Original Mortgage
$335,000
Outstanding Balance
$302,300
Interest Rate
3.1%
Mortgage Type
New Conventional
Estimated Equity
$404,082
Purchase Details
Closed on
Jan 25, 2012
Sold by
Mccarron Angela
Bought by
Gottlieb Andrew J
Purchase Details
Closed on
Aug 23, 2002
Sold by
Gottlieb Andrew
Bought by
Mccarron Angela
Create a Home Valuation Report for This Property
The Home Valuation Report is an in-depth analysis detailing your home's value as well as a comparison with similar homes in the area
Home Values in the Area
Average Home Value in this Area
Purchase History
| Date | Buyer | Sale Price | Title Company |
|---|---|---|---|
| Schwartz Hagit | -- | Your Title Experts | |
| Schwartz Hagit | -- | Your Title Experts | |
| Schwartz Hagit | -- | Your Title Experts | |
| Schwarts Steven P | $535,000 | None Available | |
| Schwarts Steven P | $535,000 | None Available | |
| Schwarts Steven P | $535,000 | None Available | |
| Schwarts Steven P | $535,000 | None Available | |
| Gottlieb Andrew J | $175,000 | -- | |
| Gottlieb Andrew J | $175,000 | -- | |
| Gottlieb Andrew J | $175,000 | -- | |
| Mccarron Angela | $220,000 | -- | |
| Mccarron Angela | $220,000 | -- |
Source: Public Records
Mortgage History
| Date | Status | Borrower | Loan Amount |
|---|---|---|---|
| Open | Schwarts Steven P | $335,000 | |
| Closed | Schwarts Steven P | $335,000 |
Source: Public Records
Tax History Compared to Growth
Tax History
| Year | Tax Paid | Tax Assessment Tax Assessment Total Assessment is a certain percentage of the fair market value that is determined by local assessors to be the total taxable value of land and additions on the property. | Land | Improvement |
|---|---|---|---|---|
| 2025 | $10,111 | $410 | $189 | $221 |
| 2024 | $1,519 | $400 | $184 | $216 |
| 2023 | $8,882 | $411 | $189 | $222 |
| 2022 | $8,882 | $411 | $189 | $222 |
| 2021 | $12,021 | $440 | $202 | $238 |
| 2020 | $5,346 | $486 | $381 | $105 |
| 2019 | $1,172 | $520 | $379 | $141 |
| 2018 | $3,258 | $544 | $0 | $0 |
| 2017 | $843 | $357 | $276 | $81 |
| 2016 | $1,658 | $414 | $228 | $186 |
| 2015 | $1,102 | $551 | $304 | $247 |
| 2014 | $1,102 | $551 | $304 | $247 |
| 2013 | $1,356 | $735 | $426 | $309 |
Source: Public Records
Map
Nearby Homes