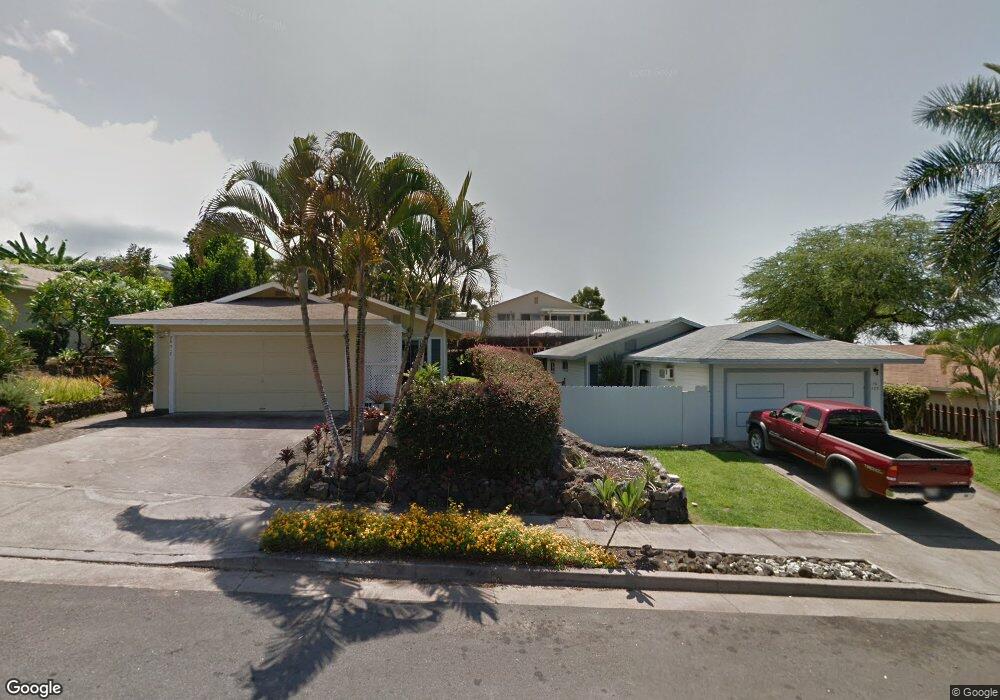
76-317 Kealoha St Unit 23A Kailua Kona, HI 96740
Estimated Value: $588,493 - $715,000
2
Beds
2
Baths
810
Sq Ft
$809/Sq Ft
Est. Value
About This Home
This home is located at 76-317 Kealoha St Unit 23A, Kailua Kona, HI 96740 and is currently estimated at $655,373, approximately $809 per square foot. 76-317 Kealoha St Unit 23A is a home located in Hawaii County with nearby schools including Kahakai Elementary School, Konawaena Middle School, and Konawaena High School.
Ownership History
Date
Name
Owned For
Owner Type
Purchase Details
Closed on
Dec 9, 2009
Sold by
Ching Thomas Kahikina
Bought by
Ching Thomas Kahikina
Current Estimated Value
Home Financials for this Owner
Home Financials are based on the most recent Mortgage that was taken out on this home.
Original Mortgage
$276,430
Outstanding Balance
$179,190
Interest Rate
4.78%
Mortgage Type
New Conventional
Estimated Equity
$476,183
Purchase Details
Closed on
Apr 7, 2008
Sold by
Martinee Ching Thomas Kahikina and Martinee Ching Kelley
Bought by
Ching Thomas Kahikina
Home Financials for this Owner
Home Financials are based on the most recent Mortgage that was taken out on this home.
Original Mortgage
$280,000
Interest Rate
6.11%
Mortgage Type
Stand Alone Refi Refinance Of Original Loan
Purchase Details
Closed on
Jun 28, 2001
Sold by
Turner Jeffrey L and Kelly Corin L
Bought by
Martinee Ching Thomas Kahikina and Martinee Ching Kelley
Home Financials for this Owner
Home Financials are based on the most recent Mortgage that was taken out on this home.
Original Mortgage
$178,480
Interest Rate
7.14%
Mortgage Type
FHA
Create a Home Valuation Report for This Property
The Home Valuation Report is an in-depth analysis detailing your home's value as well as a comparison with similar homes in the area
Home Values in the Area
Average Home Value in this Area
Purchase History
| Date | Buyer | Sale Price | Title Company |
|---|---|---|---|
| Ching Thomas Kahikina | -- | Accommodation | |
| Ching Thomas Kahikina | -- | Or | |
| Martinee Ching Thomas Kahikina | $184,000 | -- |
Source: Public Records
Mortgage History
| Date | Status | Borrower | Loan Amount |
|---|---|---|---|
| Open | Ching Thomas Kahikina | $276,430 | |
| Closed | Ching Thomas Kahikina | $280,000 | |
| Closed | Martinee Ching Thomas Kahikina | $178,480 |
Source: Public Records
Tax History Compared to Growth
Tax History
| Year | Tax Paid | Tax Assessment Tax Assessment Total Assessment is a certain percentage of the fair market value that is determined by local assessors to be the total taxable value of land and additions on the property. | Land | Improvement |
|---|---|---|---|---|
| 2025 | $438 | $230,000 | $69,300 | $160,700 |
| 2024 | $438 | $223,300 | $69,300 | $154,000 |
| 2023 | $513 | $216,800 | $69,300 | $147,500 |
| 2022 | $544 | $210,500 | $69,300 | $141,200 |
| 2021 | $514 | $204,400 | $69,300 | $135,100 |
| 2020 | $484 | $198,400 | $69,300 | $129,100 |
| 2019 | $456 | $192,600 | $69,300 | $123,300 |
| 2018 | $428 | $187,000 | $69,300 | $117,700 |
| 2017 | $402 | $181,600 | $69,300 | $112,300 |
| 2016 | $375 | $176,300 | $69,300 | $107,000 |
| 2015 | $453 | $171,200 | $69,300 | $101,900 |
| 2014 | $453 | $166,200 | $69,300 | $96,900 |
Source: Public Records
Map
Nearby Homes
- 76-197 Kealoha St
- 76-223-A Royal Poinciana Dr Unit 2
- 76-6319 Leone St
- 76-6253 Koko Olua Way
- 76-6202 Papala St
- 77-6352 Kololia St
- 78-7010 Hawai?i Belt Rd
- 76-247 Keakealani Dr
- 75-6206 Nakukui Dr
- 76-6233 Alii Dr Unit 174
- 76-6233 Alii Dr Unit 264
- 76-6183 Kumu Place
- 76-6225 Alii Dr Unit 105
- 76-6259 Alii Dr Unit 332
- 75-6171 Papala Place
- 76-6246 Alii Dr Unit 303
- 76-6246 Alii Dr Unit 324
- 76-6246 Alii Dr Unit 410
- 76-6246 Alii Dr Unit 343
- 76-6212 Alii Dr Unit 205
- 76-233 Kealoha St Unit 28B
- 76-223 Kealoha St Unit 28A
- 76-253 Kealoha St Unit 27B
- 76-241 Kealoha St Unit 27A
- 76-271 Kealoha St Unit 26B
- 76-261 Kealoha St Unit 26A
- 76-289 Kealoha St Unit 25B
- 76-281 Kealoha St Unit 25A
- 76-309 Kealoha St Unit 24B
- 76-297 Kealoha St Unit 24A
- 76-329 Kealoha St Unit 23B
- 76-349 Kealoha St Unit 22B
- 76-339 Kealoha St Unit 22A
- 76-352 Kealoha St Unit 8B
- 76-340 Kealoha St Unit 8A
- 76-328 Kealoha St Unit 7B
- 76-316 Kealoha St Unit 7A
- 76-302 Kealoha St Unit 6B
- 76-278 Kealoha St Unit 5B
- 76-266 Kealoha St Unit 5A