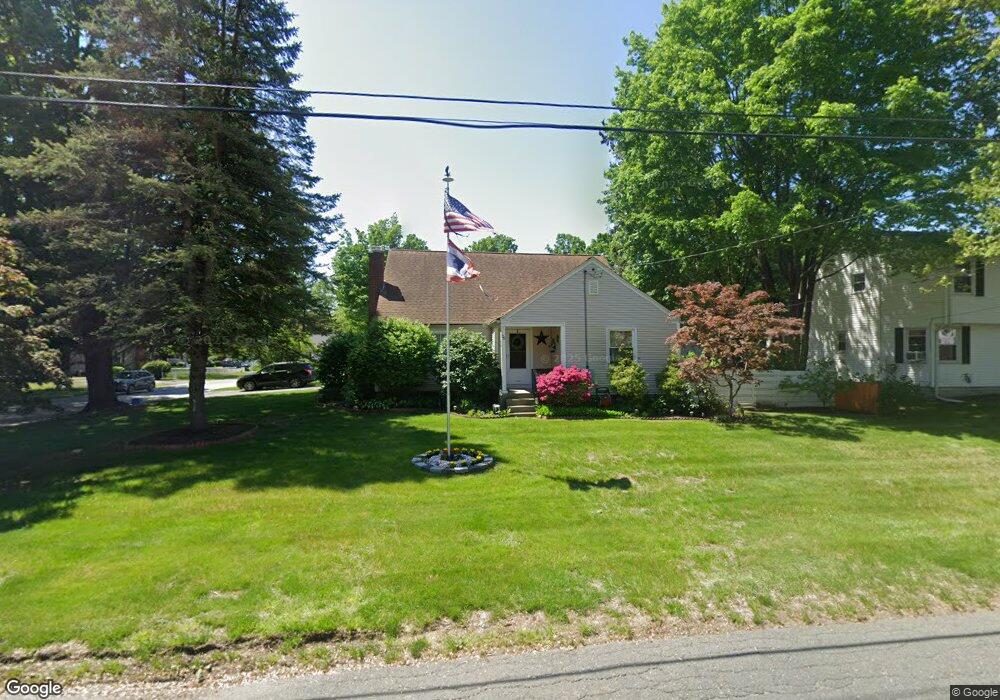
76 Anthony St Agawam, MA 01001
Estimated Value: $394,000 - $510,000
About This Home
This home is located at 76 Anthony St, Agawam, MA 01001 and is currently estimated at $432,510, approximately $210 per square foot. 76 Anthony St is a home located in Hampden County with nearby schools including Agawam Junior High School, Agawam High School, and St Thomas The Apostle School.
Ownership History
We collect this data history from publicly available records. To have your information removed, we recommend requesting removal directly through your county’s website.
Purchase Details
Home Financials for this Owner
Home Financials are based on the most recent Mortgage that was taken out on this home.Purchase Details
Home Financials for this Owner
Home Financials are based on the most recent Mortgage that was taken out on this home.Purchase Details
Home Financials for this Owner
Home Financials are based on the most recent Mortgage that was taken out on this home.Purchase Details
Purchase Details
Home Financials for this Owner
Home Financials are based on the most recent Mortgage that was taken out on this home.Purchase Details
Purchase Details
Home Values in the Area
Average Home Value in this Area
Purchase History
We collect this data history from publicly available records. To have your information removed, we recommend requesting removal directly through your county’s website.
| Date | Buyer | Sale Price | Title Company |
|---|---|---|---|
| $262,900 | -- | ||
| $239,900 | -- | ||
| $239,900 | -- | ||
| $244,500 | -- | ||
| $244,500 | -- | ||
| -- | -- | ||
| -- | -- | ||
| $157,000 | -- | ||
| $157,000 | -- | ||
| $126,500 | -- | ||
| $126,500 | -- | ||
| $126,500 | -- | ||
| $122,900 | -- |
Mortgage History
We collect this data history from publicly available records. To have your information removed, we recommend requesting removal directly through your county’s website.
| Date | Status | Borrower | Loan Amount |
|---|---|---|---|
| Open | $229,375 | ||
| Previous Owner | $233,818 | ||
| Previous Owner | $237,165 | ||
| Previous Owner | $141,000 |
Tax History
We collect this data history from publicly available records. To have your information removed, we recommend requesting removal directly through your county’s website.
| Year | Tax Paid | Tax Assessment Tax Assessment Total Assessment is a certain percentage of the fair market value that is determined by local assessors to be the total taxable value of land and additions on the property. | Land | Improvement |
|---|---|---|---|---|
| 2025 | $5,026 | $343,300 | $101,200 | $242,100 |
| 2024 | $4,800 | $330,100 | $101,200 | $228,900 |
| 2023 | $4,532 | $287,200 | $87,600 | $199,600 |
| 2022 | $4,305 | $267,200 | $87,600 | $179,600 |
| 2021 | $4,104 | $244,300 | $77,800 | $166,500 |
| 2020 | $3,985 | $236,800 | $76,600 | $160,200 |
| 2019 | $3,868 | $232,300 | $75,100 | $157,200 |
| 2018 | $3,672 | $221,100 | $75,100 | $146,000 |
| 2017 | $3,484 | $213,600 | $75,100 | $138,500 |
| 2016 | $3,359 | $207,600 | $75,100 | $132,500 |
| 2015 | $3,181 | $202,100 | $75,100 | $127,000 |
Map
- 37 Valentine St
- 75 Clematis Rd
- 22 Althea Cir
- 19 Mansion Woods Dr Unit A
- 0 Silver St
- 129 Elm St
- 69 Lealand Ave
- 96 Silver St
- 60 Silver Lake Dr
- 0 Springfield St Unit 73505279
- 117 Silver St
- 88 Country Rd
- 117 Beekman Dr
- 119 Beekman Dr
- 37 Senator Ave
- 202 Beekman Dr
- 169 Country Rd
- 58 Beekman Dr
- 83 Federal St
- 22 Hunting Ln
Ask me questions while you tour the home.