76 Barker St Staten Island, NY 10310
West Brighton NeighborhoodEstimated Value: $1,123,979
--
Bed
--
Bath
1,364
Sq Ft
$824/Sq Ft
Est. Value
About This Home
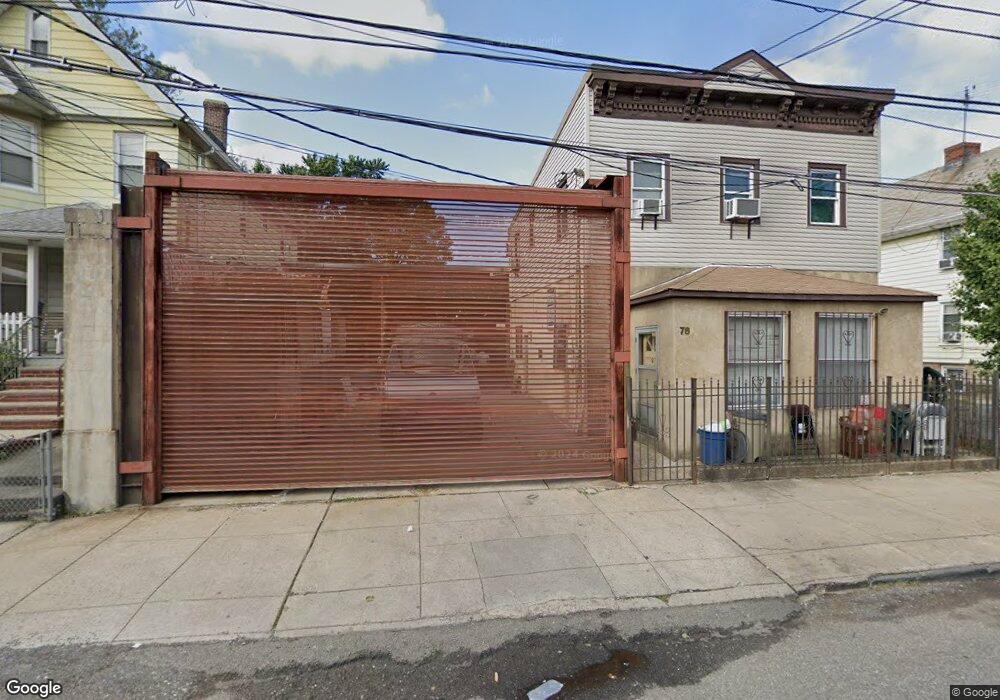
This home is located at 76 Barker St, Staten Island, NY 10310 and is currently estimated at $1,123,979, approximately $824 per square foot. 76 Barker St is a home located in Richmond County with nearby schools including P.S. 18 John G. Whittier, Intermediate School 27, and Susan E Wagner High School.
Ownership History
Date
Name
Owned For
Owner Type
Purchase Details
Closed on
May 16, 2023
Sold by
Petrecca Nicholas
Bought by
Npdp Trust
Current Estimated Value
Purchase Details
Closed on
May 27, 1999
Sold by
S & F Towing Service Staten Island Inc
Bought by
Petrecca Nicholas
Create a Home Valuation Report for This Property
The Home Valuation Report is an in-depth analysis detailing your home's value as well as a comparison with similar homes in the area
Home Values in the Area
Average Home Value in this Area
Purchase History
| Date | Buyer | Sale Price | Title Company |
|---|---|---|---|
| Npdp Trust | -- | Chicago Title | |
| Petrecca Nicholas | $83,500 | -- |
Source: Public Records
Tax History Compared to Growth
Tax History
| Year | Tax Paid | Tax Assessment Tax Assessment Total Assessment is a certain percentage of the fair market value that is determined by local assessors to be the total taxable value of land and additions on the property. | Land | Improvement |
|---|---|---|---|---|
| 2025 | $24,585 | $242,100 | $108,000 | $134,100 |
| 2024 | $24,585 | $250,200 | $108,000 | $142,200 |
| 2023 | $25,429 | $238,860 | $108,000 | $130,860 |
| 2022 | $23,957 | $222,750 | $108,000 | $114,750 |
| 2021 | $20,645 | $193,050 | $108,000 | $85,050 |
| 2020 | $69,523 | $252,450 | $108,000 | $144,450 |
| 2019 | $55,556 | $283,950 | $108,000 | $175,950 |
| 2018 | $21,253 | $229,950 | $108,000 | $121,950 |
| 2017 | $20,307 | $218,700 | $72,000 | $146,700 |
| 2016 | $17,939 | $191,700 | $72,000 | $119,700 |
| 2015 | $13,156 | $189,450 | $72,000 | $117,450 |
| 2014 | $13,156 | $180,900 | $72,000 | $108,900 |
Source: Public Records
Map
Nearby Homes