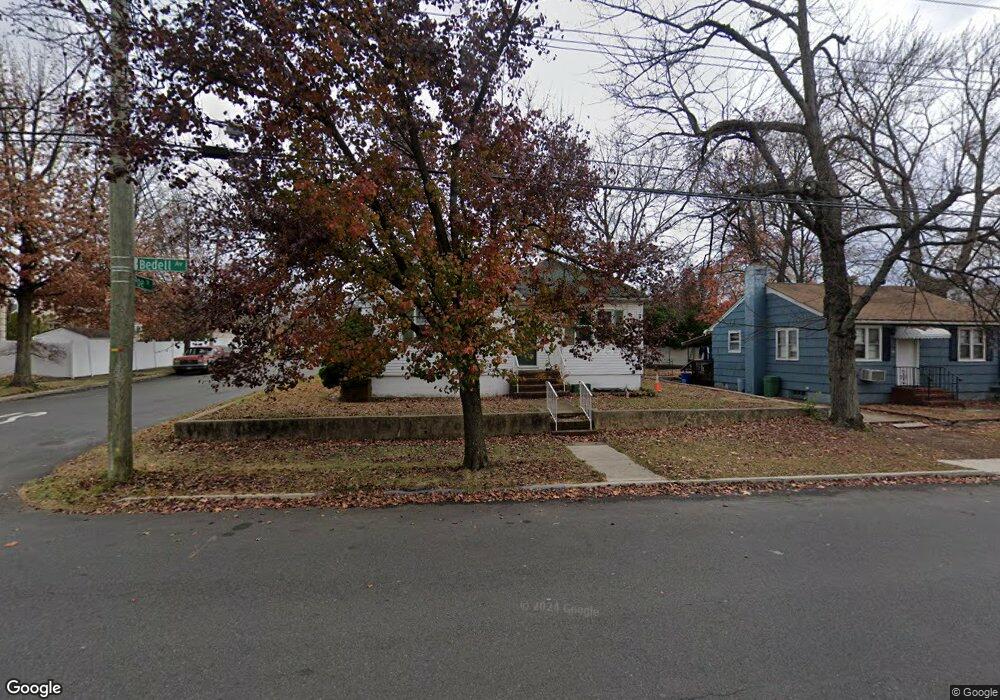
76 Bedell Ave Staten Island, NY 10307
Tottenville NeighborhoodEstimated Value: $656,990 - $944,000
3
Beds
1
Bath
1,108
Sq Ft
$720/Sq Ft
Est. Value
About This Home
This home is located at 76 Bedell Ave, Staten Island, NY 10307 and is currently estimated at $797,998, approximately $720 per square foot. 76 Bedell Ave is a home located in Richmond County with nearby schools including P.S. 6 Cpl Allan F Kivlehan School, Is 34 Tottenville, and Tottenville High School.
Ownership History
Date
Name
Owned For
Owner Type
Purchase Details
Closed on
Aug 11, 1997
Sold by
Moller Eugene V and Mandracchia Bonnie I
Bought by
Moze William R
Current Estimated Value
Purchase Details
Closed on
Sep 26, 1996
Sold by
Green Jeffrey and Green Marilyn
Bought by
Moller Eugene V and Mandracchia Bonnie I
Home Financials for this Owner
Home Financials are based on the most recent Mortgage that was taken out on this home.
Original Mortgage
$105,000
Interest Rate
7.99%
Create a Home Valuation Report for This Property
The Home Valuation Report is an in-depth analysis detailing your home's value as well as a comparison with similar homes in the area
Home Values in the Area
Average Home Value in this Area
Purchase History
| Date | Buyer | Sale Price | Title Company |
|---|---|---|---|
| Moze William R | $220,000 | -- | |
| Moller Eugene V | $150,000 | Commonwealth Land Title Ins |
Source: Public Records
Mortgage History
| Date | Status | Borrower | Loan Amount |
|---|---|---|---|
| Previous Owner | Moller Eugene V | $105,000 |
Source: Public Records
Tax History Compared to Growth
Tax History
| Year | Tax Paid | Tax Assessment Tax Assessment Total Assessment is a certain percentage of the fair market value that is determined by local assessors to be the total taxable value of land and additions on the property. | Land | Improvement |
|---|---|---|---|---|
| 2025 | $5,914 | $38,160 | $15,246 | $22,914 |
| 2024 | $5,914 | $32,520 | $16,877 | $15,643 |
| 2023 | $5,546 | $30,494 | $13,463 | $17,031 |
| 2022 | $5,226 | $38,820 | $16,980 | $21,840 |
| 2021 | $5,594 | $36,000 | $16,980 | $19,020 |
| 2020 | $5,434 | $36,360 | $16,980 | $19,380 |
| 2019 | $5,032 | $31,620 | $16,980 | $14,640 |
| 2018 | $4,296 | $25,412 | $14,587 | $10,825 |
| 2017 | $4,556 | $25,412 | $14,558 | $10,854 |
| 2016 | $4,286 | $24,549 | $15,577 | $8,972 |
| 2015 | $3,737 | $23,793 | $12,102 | $11,691 |
| 2014 | $3,737 | $22,447 | $9,920 | $12,527 |
Source: Public Records
Map
Nearby Homes