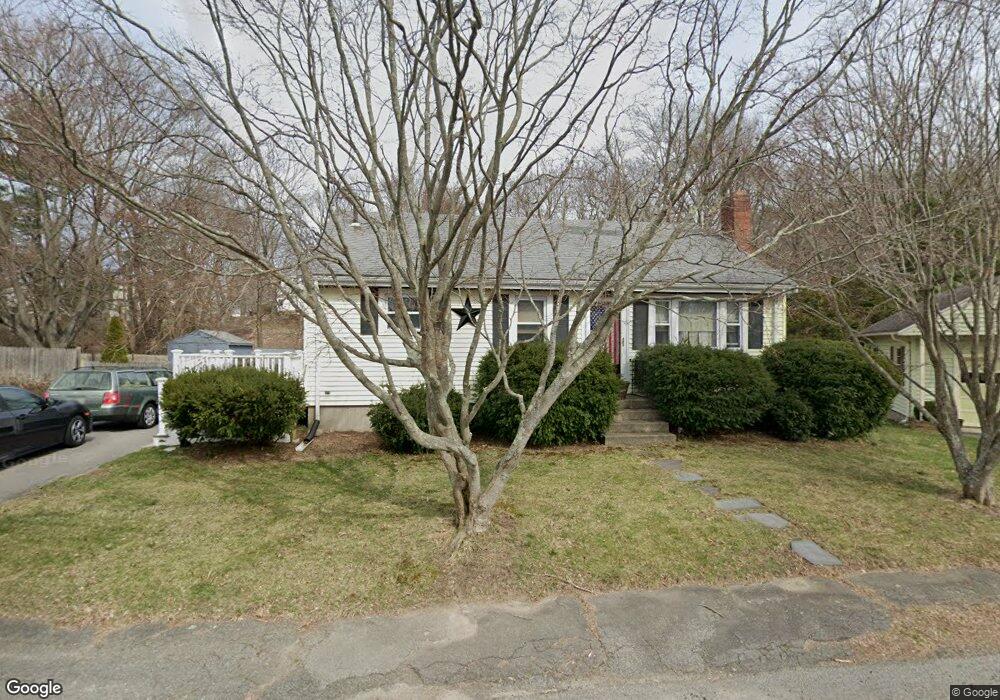
76 Branch Rd South Weymouth, MA 02190
Estimated Value: $558,969 - $582,000
3
Beds
1
Bath
900
Sq Ft
$631/Sq Ft
Est. Value
About This Home
This home is located at 76 Branch Rd, South Weymouth, MA 02190 and is currently estimated at $567,492, approximately $630 per square foot. 76 Branch Rd is a home located in Norfolk County with nearby schools including Ralph Talbot Primary School, Abigail Adams Middle School, and Weymouth Middle School Chapman.
Ownership History
Date
Name
Owned For
Owner Type
Purchase Details
Closed on
Apr 22, 2016
Sold by
Tuffo Gabriel M and Tuffo Dianne
Bought by
Phillips Mark E
Current Estimated Value
Home Financials for this Owner
Home Financials are based on the most recent Mortgage that was taken out on this home.
Original Mortgage
$309,003
Outstanding Balance
$245,484
Interest Rate
3.68%
Mortgage Type
VA
Estimated Equity
$322,008
Purchase Details
Closed on
Dec 16, 2010
Sold by
Tuffo Dianne
Bought by
Tuffo Gabriel M and Tuffo Dianne
Purchase Details
Closed on
Dec 30, 2005
Sold by
Hassell Joseph W
Bought by
Tuffo Diane and Tuffo Gabriel M
Home Financials for this Owner
Home Financials are based on the most recent Mortgage that was taken out on this home.
Original Mortgage
$244,000
Interest Rate
6.39%
Mortgage Type
Purchase Money Mortgage
Create a Home Valuation Report for This Property
The Home Valuation Report is an in-depth analysis detailing your home's value as well as a comparison with similar homes in the area
Home Values in the Area
Average Home Value in this Area
Purchase History
| Date | Buyer | Sale Price | Title Company |
|---|---|---|---|
| Phillips Mark E | $302,500 | -- | |
| Tuffo Gabriel M | -- | -- | |
| Tuffo Dianne | -- | -- | |
| Tuffo Diane | $305,000 | -- |
Source: Public Records
Mortgage History
| Date | Status | Borrower | Loan Amount |
|---|---|---|---|
| Open | Phillips Mark E | $309,003 | |
| Previous Owner | Tuffo Diane | $244,000 | |
| Previous Owner | Tuffo Diane | $61,000 |
Source: Public Records
Tax History Compared to Growth
Tax History
| Year | Tax Paid | Tax Assessment Tax Assessment Total Assessment is a certain percentage of the fair market value that is determined by local assessors to be the total taxable value of land and additions on the property. | Land | Improvement |
|---|---|---|---|---|
| 2025 | $4,813 | $476,500 | $223,000 | $253,500 |
| 2024 | $4,674 | $455,100 | $212,400 | $242,700 |
| 2023 | $4,634 | $443,400 | $214,500 | $228,900 |
| 2022 | $4,582 | $399,800 | $198,700 | $201,100 |
| 2021 | $4,215 | $359,000 | $198,700 | $160,300 |
| 2020 | $3,978 | $333,700 | $198,700 | $135,000 |
| 2019 | $3,867 | $319,100 | $191,000 | $128,100 |
| 2018 | $3,758 | $300,600 | $181,900 | $118,700 |
| 2017 | $3,669 | $286,400 | $173,300 | $113,100 |
| 2016 | $3,525 | $275,400 | $166,600 | $108,800 |
| 2015 | $3,447 | $267,200 | $166,600 | $100,600 |
| 2014 | $3,353 | $252,100 | $155,000 | $97,100 |
Source: Public Records
Map
Nearby Homes
- 45 Cherry Ln
- 17 Sears Rd
- 41 Oak St
- 5 Oak St
- 206 Pine St
- 26 Leahaven Rd
- 11 White St
- 261 Pleasant St Unit 5
- 120 Burkhall St Unit K
- 17 Buchanan Ln
- 159 Tall Oaks Dr Unit D
- 121 Tall Oaks Dr Unit Q
- 207 Central St
- 200 Burkhall St Unit 803
- 200 Burkhall St Unit 103
- 32 Weaver Rd
- 45 Union St
- 197 White St
- 54 Old Quarry Dr
- 27 Park Ave