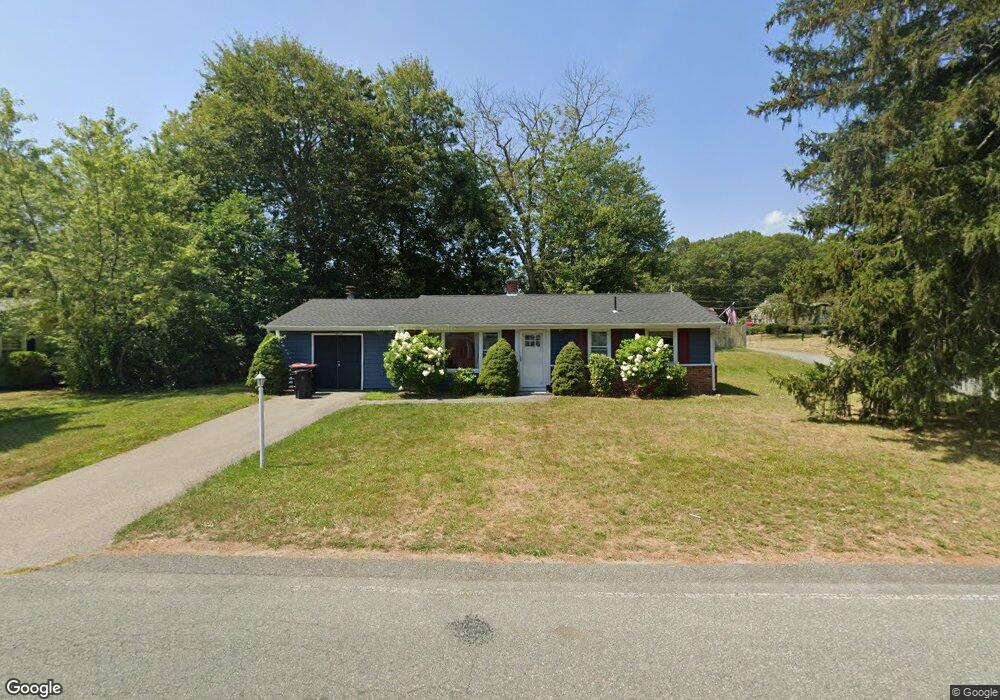
76 Colgate Rd Unit 1 Brockton, MA 02302
Montello NeighborhoodEstimated Value: $472,000 - $499,000
3
Beds
1
Bath
1,216
Sq Ft
$396/Sq Ft
Est. Value
About This Home
This home is located at 76 Colgate Rd Unit 1, Brockton, MA 02302 and is currently estimated at $481,407, approximately $395 per square foot. 76 Colgate Rd Unit 1 is a home located in Plymouth County with nearby schools including Brookfield Elementary School, Downey Elementary School, and Ashfield Middle School.
Ownership History
Date
Name
Owned For
Owner Type
Purchase Details
Closed on
Feb 13, 2017
Sold by
Kotlik John
Bought by
Vanon Vanessa F
Current Estimated Value
Home Financials for this Owner
Home Financials are based on the most recent Mortgage that was taken out on this home.
Original Mortgage
$232,800
Outstanding Balance
$193,393
Interest Rate
4.32%
Mortgage Type
New Conventional
Estimated Equity
$288,014
Purchase Details
Closed on
Jan 19, 2011
Sold by
Garjian Sebouh
Bought by
Kotlik John
Purchase Details
Closed on
Jul 19, 2010
Sold by
Wyson Karen E and Crombie Mark
Bought by
Garjian Sebouh
Create a Home Valuation Report for This Property
The Home Valuation Report is an in-depth analysis detailing your home's value as well as a comparison with similar homes in the area
Home Values in the Area
Average Home Value in this Area
Purchase History
| Date | Buyer | Sale Price | Title Company |
|---|---|---|---|
| Vanon Vanessa F | $240,000 | -- | |
| Kotlik John | -- | -- | |
| Garjian Sebouh | $135,000 | -- |
Source: Public Records
Mortgage History
| Date | Status | Borrower | Loan Amount |
|---|---|---|---|
| Open | Vanon Vanessa F | $232,800 |
Source: Public Records
Tax History Compared to Growth
Tax History
| Year | Tax Paid | Tax Assessment Tax Assessment Total Assessment is a certain percentage of the fair market value that is determined by local assessors to be the total taxable value of land and additions on the property. | Land | Improvement |
|---|---|---|---|---|
| 2025 | $4,688 | $387,100 | $145,200 | $241,900 |
| 2024 | $4,563 | $379,600 | $145,200 | $234,400 |
| 2023 | $4,333 | $333,800 | $110,200 | $223,600 |
| 2022 | $4,225 | $302,400 | $100,200 | $202,200 |
| 2021 | $3,925 | $270,700 | $95,100 | $175,600 |
| 2020 | $3,863 | $255,000 | $91,100 | $163,900 |
| 2019 | $3,848 | $247,600 | $85,600 | $162,000 |
| 2018 | $3,321 | $206,800 | $85,600 | $121,200 |
| 2017 | $3,041 | $188,900 | $85,600 | $103,300 |
| 2016 | $2,962 | $170,600 | $81,600 | $89,000 |
| 2015 | $3,000 | $165,300 | $81,600 | $83,700 |
| 2014 | $2,988 | $164,800 | $81,600 | $83,200 |
Source: Public Records
Map
Nearby Homes