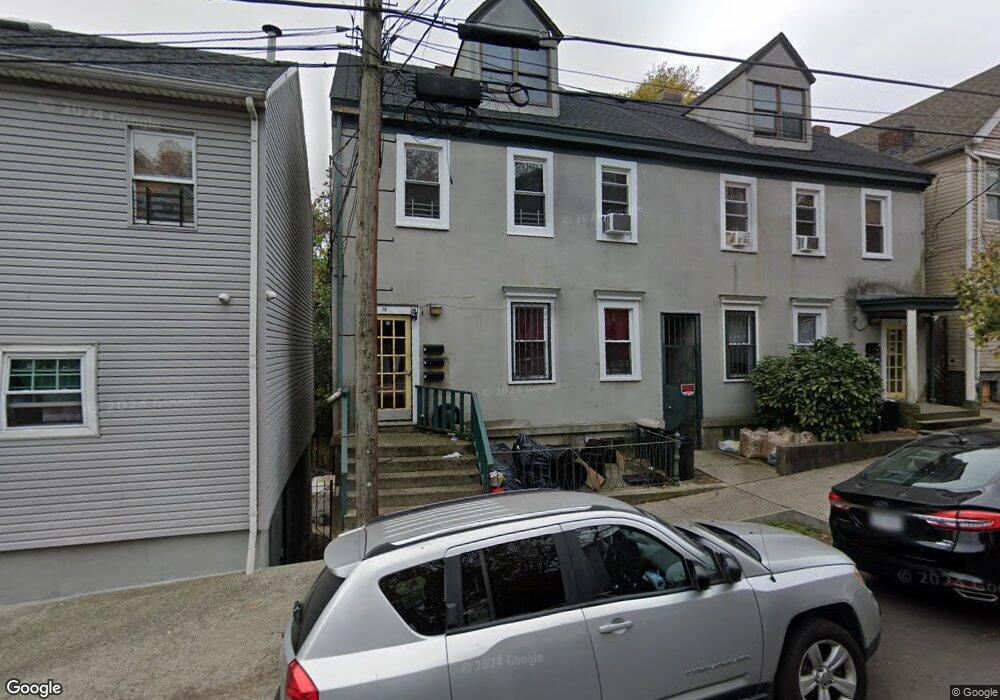
76 Corson Ave Staten Island, NY 10301
Saint George NeighborhoodEstimated Value: $594,004 - $818,000
--
Bed
--
Bath
3,300
Sq Ft
$221/Sq Ft
Est. Value
About This Home
This home is located at 76 Corson Ave, Staten Island, NY 10301 and is currently estimated at $729,251, approximately $220 per square foot. 76 Corson Ave is a home located in Richmond County with nearby schools including P.S. 16 John J Driscoll, Fort Hill Collaborative Elementary, and P.S. 74 Future Leaders Elementary School.
Ownership History
Date
Name
Owned For
Owner Type
Purchase Details
Closed on
Jan 19, 2022
Sold by
Veksler Elina
Bought by
Corson Ave Holdings Llc
Current Estimated Value
Purchase Details
Closed on
Oct 28, 1994
Sold by
76-78 Corson Avenue Inc
Bought by
Waldschlagel Owen
Home Financials for this Owner
Home Financials are based on the most recent Mortgage that was taken out on this home.
Original Mortgage
$130,162
Interest Rate
8.81%
Create a Home Valuation Report for This Property
The Home Valuation Report is an in-depth analysis detailing your home's value as well as a comparison with similar homes in the area
Home Values in the Area
Average Home Value in this Area
Purchase History
| Date | Buyer | Sale Price | Title Company |
|---|---|---|---|
| Corson Ave Holdings Llc | -- | Absolute Title Agency | |
| Waldschlagel Owen | -- | -- |
Source: Public Records
Mortgage History
| Date | Status | Borrower | Loan Amount |
|---|---|---|---|
| Previous Owner | Waldschlagel Owen | $130,162 |
Source: Public Records
Tax History Compared to Growth
Tax History
| Year | Tax Paid | Tax Assessment Tax Assessment Total Assessment is a certain percentage of the fair market value that is determined by local assessors to be the total taxable value of land and additions on the property. | Land | Improvement |
|---|---|---|---|---|
| 2025 | $3,051 | $60,480 | $2,215 | $58,265 |
| 2024 | $3,051 | $60,300 | $2,222 | $58,078 |
| 2023 | $3,061 | $15,070 | $1,913 | $13,157 |
| 2022 | $2,205 | $56,520 | $8,820 | $47,700 |
| 2021 | $2,823 | $46,800 | $8,820 | $37,980 |
| 2020 | $2,719 | $44,160 | $8,820 | $35,340 |
| 2019 | $2,674 | $41,100 | $8,820 | $32,280 |
| 2018 | $2,560 | $12,558 | $3,375 | $9,183 |
| 2017 | $2,415 | $11,848 | $3,985 | $7,863 |
| 2016 | $2,235 | $11,179 | $3,931 | $7,248 |
| 2015 | $2,024 | $10,549 | $3,301 | $7,248 |
| 2014 | $2,024 | $10,549 | $3,782 | $6,767 |
Source: Public Records
Map
Nearby Homes
- 80 Corson Ave
- 416 Westervelt Ave
- 97 Victory Blvd
- 50 Brook St
- 96 Victory Blvd
- 94 Victory Blvd
- 19 Scribner Ave
- 32 Scribner Ave
- 65 Brook St
- 78 Victory Blvd
- 9-11 Corson Ave
- 47,49 Tompkins Cir
- 47 Tompkins Cir
- 344 Westervelt Ave
- 27 Tompkins Cir
- 109 Monroe Ave
- 12 Saint Pauls Ave
- 103 Monroe Ave
- 130 Montgomery Ave
- 99 Monroe Ave
- 76 Corson Ave Unit /78
- 78 Corson Ave
- 72 Corson Ave
- 70 Corson Ave
- 431 Westervelt Ave
- 433 Westervelt Ave
- 72-52 Fremont St
- 67-36 Fremont St
- 19 Brook St
- 435 Westervelt Ave
- 69-16 Fremont St
- 17 Brook St
- 437 Westervelt Ave
- 417 Westervelt Ave
- 415 Westervelt Ave
- 73 Corson Ave
- 441 Westervelt Ave
- 23 Brook St Unit 1st Floor
- 23 Brook St Unit 3rd Fl
- 23 Brook St