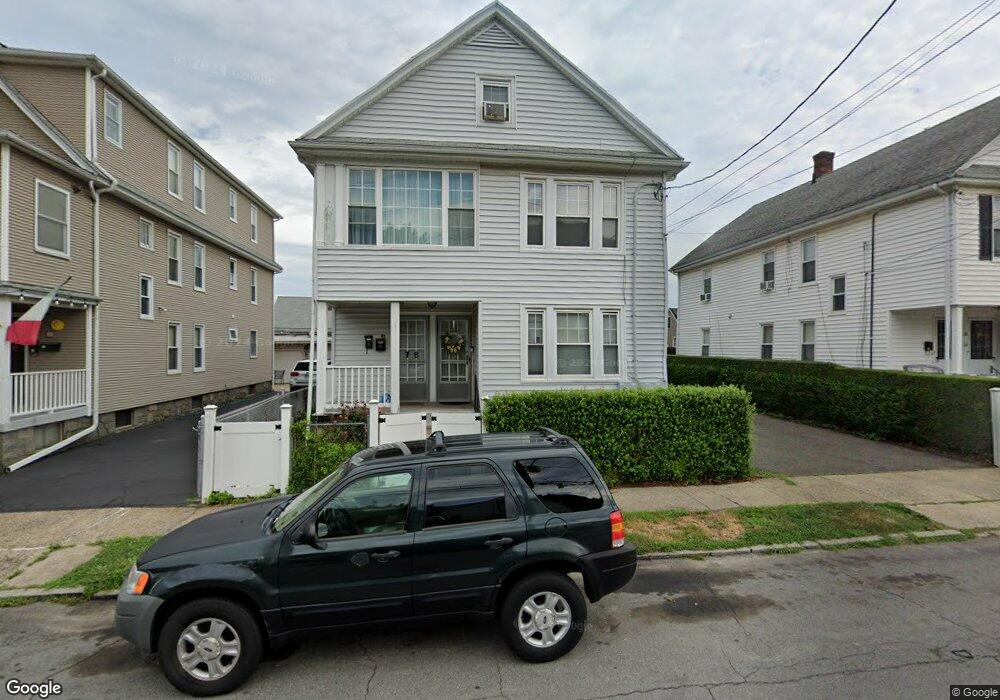
76 Crowther Ave Unit 78 Bridgeport, CT 06605
Black Rock NeighborhoodEstimated Value: $530,727 - $667,000
4
Beds
2
Baths
3,314
Sq Ft
$185/Sq Ft
Est. Value
About This Home
This home is located at 76 Crowther Ave Unit 78, Bridgeport, CT 06605 and is currently estimated at $612,182, approximately $184 per square foot. 76 Crowther Ave Unit 78 is a home located in Fairfield County with nearby schools including Black Rock School, Bassick High School, and Great Oaks Charter School Bridgeport.
Ownership History
Date
Name
Owned For
Owner Type
Purchase Details
Closed on
Feb 4, 2025
Sold by
76-78 Crowther Ave Llc
Bought by
Mustafaj Marline
Current Estimated Value
Home Financials for this Owner
Home Financials are based on the most recent Mortgage that was taken out on this home.
Original Mortgage
$203,000
Outstanding Balance
$201,805
Interest Rate
6.96%
Mortgage Type
New Conventional
Estimated Equity
$410,377
Purchase Details
Closed on
Aug 19, 2020
Sold by
Mustafaj Marline and Mustafaj Orhan
Bought by
76-78 Crowther Ave Llc
Purchase Details
Closed on
Jan 10, 2007
Sold by
Urban Margaret and Hicks Lynda
Bought by
Brown Marline and Mustafat Orhan
Home Financials for this Owner
Home Financials are based on the most recent Mortgage that was taken out on this home.
Original Mortgage
$550,200
Interest Rate
6.18%
Create a Home Valuation Report for This Property
The Home Valuation Report is an in-depth analysis detailing your home's value as well as a comparison with similar homes in the area
Home Values in the Area
Average Home Value in this Area
Purchase History
| Date | Buyer | Sale Price | Title Company |
|---|---|---|---|
| Mustafaj Marline | -- | None Available | |
| 76-78 Crowther Ave Llc | -- | None Available | |
| 76-78 Crowther Ave Llc | -- | None Available | |
| Brown Marline | $350,200 | -- | |
| Brown Marline | $350,200 | -- |
Source: Public Records
Mortgage History
| Date | Status | Borrower | Loan Amount |
|---|---|---|---|
| Open | Mustafaj Marline | $203,000 | |
| Previous Owner | Brown Marline | $550,200 |
Source: Public Records
Tax History Compared to Growth
Tax History
| Year | Tax Paid | Tax Assessment Tax Assessment Total Assessment is a certain percentage of the fair market value that is determined by local assessors to be the total taxable value of land and additions on the property. | Land | Improvement |
|---|---|---|---|---|
| 2025 | $10,503 | $241,720 | $109,070 | $132,650 |
| 2024 | $10,503 | $241,720 | $109,070 | $132,650 |
| 2023 | $10,503 | $241,720 | $109,070 | $132,650 |
| 2022 | $10,503 | $241,720 | $109,070 | $132,650 |
| 2021 | $10,503 | $241,720 | $109,070 | $132,650 |
| 2020 | $9,307 | $172,380 | $70,810 | $101,570 |
| 2019 | $9,307 | $172,380 | $70,810 | $101,570 |
| 2018 | $9,372 | $172,380 | $70,810 | $101,570 |
| 2017 | $9,372 | $172,380 | $70,810 | $101,570 |
| 2016 | $9,372 | $172,380 | $70,810 | $101,570 |
| 2015 | $8,191 | $194,110 | $59,500 | $134,610 |
| 2014 | $8,191 | $194,110 | $59,500 | $134,610 |
Source: Public Records
Map
Nearby Homes
- 167 Scofield Ave
- 105 Scofield Ave
- 82 Waldorf Ave
- 135 Whittier St
- 144 Whittier St
- 166 Alfred St
- 31 Whittier St
- 25 Whittier St
- 51 Princeton St
- 855 Brewster St Unit 857
- 2773 Fairfield Ave Unit 3
- 37 Rowsley St Unit 6
- 26 Rowsley St Unit 3
- 20 Haddon St Unit 5
- 554 Brewster St Unit 4
- 165 Bennett St
- 222 Ellsworth St
- 118 Berwick Ave
- 130 Brentwood Ave
- 145 Brentwood Ave
- 84 Crowther Ave Unit 88
- 84 Crowther Ave Unit 2
- 92 Crowther Ave
- 92 Crowther Ave Unit 1
- 77 Crowther Ave
- 206 Scofield Ave
- 208 Scofield Ave
- 66 Crowther Ave Unit 68
- 97 Crowther Ave
- 87 Crowther Ave
- 271 Hansen Ave
- 287 Hansen Ave
- 265 Hansen Ave
- 67 Crowther Ave
- 188 Scofield Ave
- 48 Crowther Ave Unit 50
- 257 Hansen Ave
- 193 Canfield Ave Unit 2nd fl
- 176 Canfield Ave
- 196 Canfield Ave