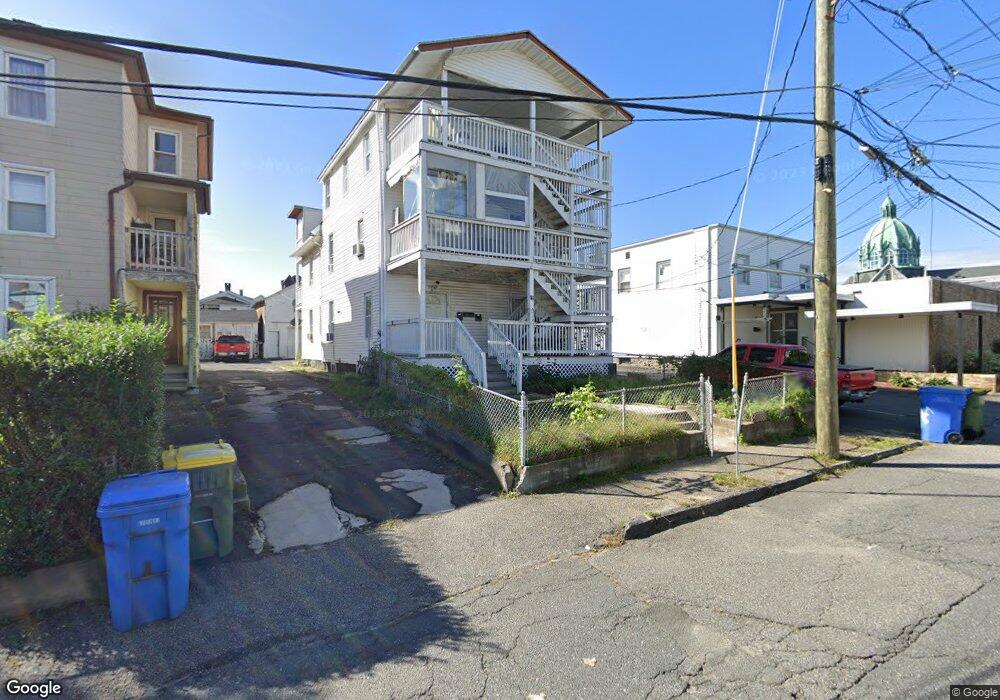
76 E Clay St Waterbury, CT 06706
South End District NeighborhoodEstimated Value: $140,378 - $414,000
6
Beds
3
Baths
3,205
Sq Ft
$94/Sq Ft
Est. Value
About This Home
This home is located at 76 E Clay St, Waterbury, CT 06706 and is currently estimated at $302,845, approximately $94 per square foot. 76 E Clay St is a home located in New Haven County with nearby schools including Washington School, West Side Middle School, and John F. Kennedy High School.
Ownership History
Date
Name
Owned For
Owner Type
Purchase Details
Closed on
Sep 1, 2021
Sold by
Boedhoe Mohani
Bought by
Boedhoe Mohani
Current Estimated Value
Purchase Details
Closed on
Jul 9, 2019
Sold by
Nankoo Totaram Est and Boedhoe
Bought by
Boedhoe Mohani
Purchase Details
Closed on
Dec 17, 2018
Sold by
Nankoo Badesh
Bought by
Boedhoe Mohani
Purchase Details
Closed on
Jun 28, 1999
Sold by
Frigon Leon and Marcoux Bryan
Bought by
Nankoo Mcihael
Create a Home Valuation Report for This Property
The Home Valuation Report is an in-depth analysis detailing your home's value as well as a comparison with similar homes in the area
Home Values in the Area
Average Home Value in this Area
Purchase History
| Date | Buyer | Sale Price | Title Company |
|---|---|---|---|
| Boedhoe Mohani | -- | None Available | |
| Boedhoe Mohani | -- | -- | |
| Boedhoe Mohani | -- | -- | |
| Nankoo Mcihael | $45,000 | -- |
Source: Public Records
Mortgage History
| Date | Status | Borrower | Loan Amount |
|---|---|---|---|
| Previous Owner | Nankoo Mcihael | $25,000 | |
| Previous Owner | Nankoo Mcihael | $192,000 | |
| Previous Owner | Nankoo Mcihael | $153,000 |
Source: Public Records
Tax History Compared to Growth
Tax History
| Year | Tax Paid | Tax Assessment Tax Assessment Total Assessment is a certain percentage of the fair market value that is determined by local assessors to be the total taxable value of land and additions on the property. | Land | Improvement |
|---|---|---|---|---|
| 2025 | $5,098 | $113,330 | $8,050 | $105,280 |
| 2024 | $5,603 | $113,330 | $8,050 | $105,280 |
| 2023 | $6,141 | $113,330 | $8,050 | $105,280 |
| 2022 | $3,577 | $59,410 | $8,020 | $51,390 |
| 2021 | $3,577 | $59,410 | $8,020 | $51,390 |
| 2020 | $3,577 | $59,410 | $8,020 | $51,390 |
| 2019 | $3,577 | $59,410 | $8,020 | $51,390 |
| 2018 | $3,577 | $59,410 | $8,020 | $51,390 |
| 2017 | $3,855 | $64,030 | $8,030 | $56,000 |
| 2016 | $3,855 | $64,030 | $8,030 | $56,000 |
| 2015 | $3,728 | $64,030 | $8,030 | $56,000 |
| 2014 | $3,728 | $64,030 | $8,030 | $56,000 |
Source: Public Records
Map
Nearby Homes