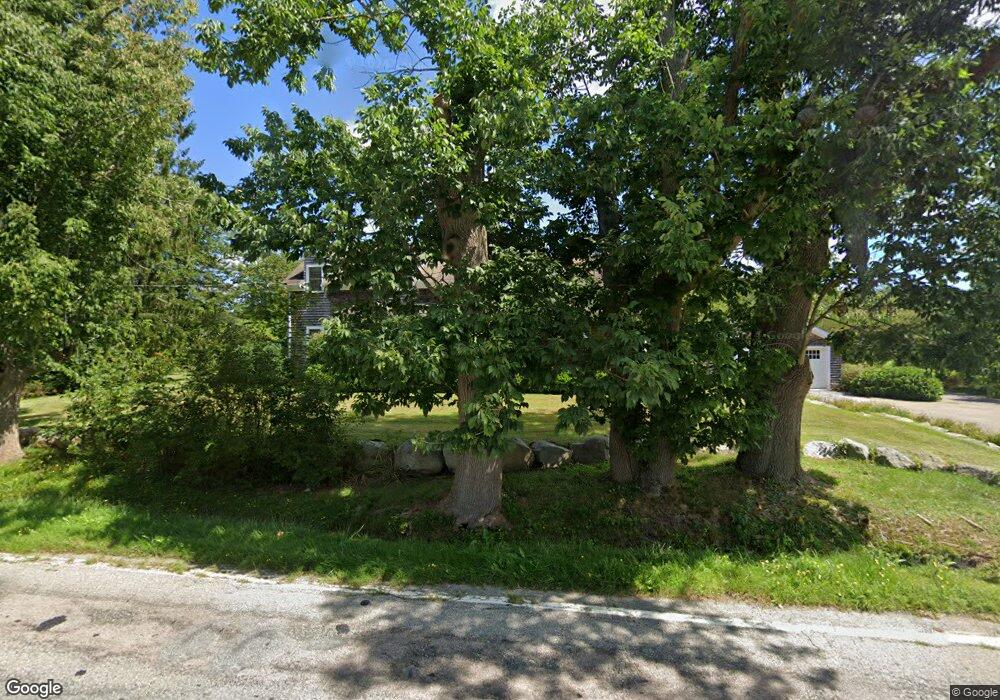
76 E Main Rd Little Compton, RI 02837
Estimated Value: $954,000 - $1,113,000
3
Beds
3
Baths
2,584
Sq Ft
$393/Sq Ft
Est. Value
About This Home
This home is located at 76 E Main Rd, Little Compton, RI 02837 and is currently estimated at $1,014,634, approximately $392 per square foot. 76 E Main Rd is a home located in Newport County with nearby schools including Wilbur & McMahon School.
Ownership History
Date
Name
Owned For
Owner Type
Purchase Details
Closed on
Sep 20, 2025
Sold by
Lyons Stephen
Bought by
Lyons Stephen and Lyons Lindsay A
Current Estimated Value
Purchase Details
Closed on
Aug 12, 2025
Sold by
Register Raven
Bought by
Lyons Stephen
Purchase Details
Closed on
Aug 30, 2016
Sold by
Lyons Stephen and Lyons Frank J
Bought by
Lyons Frank
Purchase Details
Closed on
Nov 18, 2004
Sold by
Marion 3Rd Joseph and Marion Sarah
Bought by
Lyons Stephen and Lyons Frank
Purchase Details
Closed on
Nov 12, 2002
Sold by
Marion Joseph
Bought by
Marion Joseph and Marion Susan
Home Financials for this Owner
Home Financials are based on the most recent Mortgage that was taken out on this home.
Original Mortgage
$150,000
Interest Rate
6.04%
Mortgage Type
Purchase Money Mortgage
Create a Home Valuation Report for This Property
The Home Valuation Report is an in-depth analysis detailing your home's value as well as a comparison with similar homes in the area
Home Values in the Area
Average Home Value in this Area
Purchase History
| Date | Buyer | Sale Price | Title Company |
|---|---|---|---|
| Lyons Stephen | -- | -- | |
| Lyons Stephen | $198,000 | -- | |
| Lyons Stephen J | $198,000 | -- | |
| Lyons Stephen | $198,000 | -- | |
| Lyons Stephen J | $198,000 | -- | |
| Lyons Frank | -- | -- | |
| Lyons Frank J | -- | -- | |
| Lyons Stephen | $415,000 | -- | |
| Lyons Stephen | $415,000 | -- | |
| Marion Joseph | $130,000 | -- | |
| Marion Joseph | $130,000 | -- |
Source: Public Records
Mortgage History
| Date | Status | Borrower | Loan Amount |
|---|---|---|---|
| Previous Owner | Marion Joseph | $250,000 | |
| Previous Owner | Marion Joseph | $150,000 |
Source: Public Records
Tax History
| Year | Tax Paid | Tax Assessment Tax Assessment Total Assessment is a certain percentage of the fair market value that is determined by local assessors to be the total taxable value of land and additions on the property. | Land | Improvement |
|---|---|---|---|---|
| 2025 | $3,944 | $823,300 | $215,600 | $607,700 |
| 2024 | $3,221 | $634,100 | $170,100 | $464,000 |
| 2023 | $3,145 | $634,100 | $170,100 | $464,000 |
| 2022 | $3,107 | $634,100 | $170,100 | $464,000 |
| 2021 | $3,588 | $594,000 | $148,200 | $445,800 |
| 2020 | $3,558 | $594,000 | $148,200 | $445,800 |
| 2019 | $3,522 | $594,000 | $148,200 | $445,800 |
| 2018 | $3,654 | $613,100 | $148,200 | $464,900 |
| 2016 | $3,476 | $613,100 | $148,200 | $464,900 |
| 2015 | $3,670 | $638,200 | $134,900 | $503,300 |
| 2014 | $3,599 | $638,200 | $134,900 | $503,300 |
Source: Public Records
Map
Nearby Homes
- 0 Willow Ave
- 505 Long Hwy
- 141 Peckham Rd
- 138 Willow Ave
- 140I Long Hwy
- 140 Long Hwy
- 255 John Dyer Rd
- 180 W Main Rd
- 128 Maple Ave
- 245 John Dyer Rd
- 116 Amy Hart Path
- 17 Amy Hart Path
- 141 S Of Commons Rd
- 155 W Main Rd
- 17 Ferolbink Way
- 502 Southlake Rd
- 90 Two Rod Rd
- 89 S Shore Rd
- 30 Indian Rd
- 441 W Main Rd
Your Personal Tour Guide
Ask me questions while you tour the home.