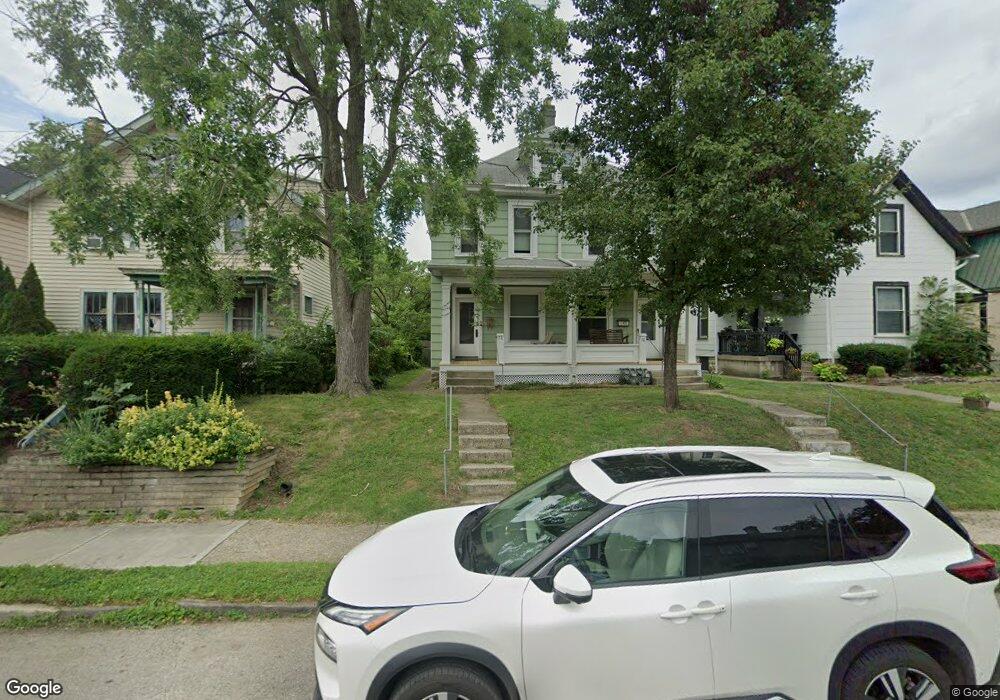
76 E Maynard Ave Unit 78 Columbus, OH 43202
Old North Columbus NeighborhoodEstimated Value: $360,000 - $467,000
6
Beds
2
Baths
2,760
Sq Ft
$155/Sq Ft
Est. Value
About This Home
This home is located at 76 E Maynard Ave Unit 78, Columbus, OH 43202 and is currently estimated at $429,126, approximately $155 per square foot. 76 E Maynard Ave Unit 78 is a home located in Franklin County with nearby schools including Hubbard Elementary School, Dominion Middle School, and Whetstone High School.
Ownership History
Date
Name
Owned For
Owner Type
Purchase Details
Closed on
Apr 27, 2001
Sold by
Shaw Lari R and Shaw Travis C
Bought by
Koehler A Joseph
Current Estimated Value
Home Financials for this Owner
Home Financials are based on the most recent Mortgage that was taken out on this home.
Original Mortgage
$139,308
Outstanding Balance
$49,197
Interest Rate
6.95%
Mortgage Type
FHA
Estimated Equity
$379,929
Purchase Details
Closed on
Dec 18, 2000
Sold by
Robertson James G and Robertson James R
Bought by
Shaw Lari R and Shaw Travis C
Home Financials for this Owner
Home Financials are based on the most recent Mortgage that was taken out on this home.
Original Mortgage
$117,000
Interest Rate
7.69%
Mortgage Type
Purchase Money Mortgage
Purchase Details
Closed on
Jun 20, 1989
Bought by
Robertson James G
Purchase Details
Closed on
Mar 1, 1979
Create a Home Valuation Report for This Property
The Home Valuation Report is an in-depth analysis detailing your home's value as well as a comparison with similar homes in the area
Home Values in the Area
Average Home Value in this Area
Purchase History
| Date | Buyer | Sale Price | Title Company |
|---|---|---|---|
| Koehler A Joseph | $140,800 | Chicago Title | |
| Shaw Lari R | $130,000 | -- | |
| Robertson James G | $70,000 | -- | |
| -- | $35,800 | -- |
Source: Public Records
Mortgage History
| Date | Status | Borrower | Loan Amount |
|---|---|---|---|
| Open | Koehler A Joseph | $139,308 | |
| Previous Owner | Shaw Lari R | $117,000 |
Source: Public Records
Tax History
| Year | Tax Paid | Tax Assessment Tax Assessment Total Assessment is a certain percentage of the fair market value that is determined by local assessors to be the total taxable value of land and additions on the property. | Land | Improvement |
|---|---|---|---|---|
| 2025 | $6,680 | $147,280 | $38,010 | $109,270 |
| 2024 | $6,680 | $147,280 | $38,010 | $109,270 |
| 2023 | $6,595 | $147,280 | $38,010 | $109,270 |
| 2022 | $5,169 | $98,460 | $22,750 | $75,710 |
| 2021 | $5,179 | $98,460 | $22,750 | $75,710 |
| 2020 | $5,186 | $98,460 | $22,750 | $75,710 |
| 2019 | $4,837 | $78,750 | $18,200 | $60,550 |
| 2018 | $4,446 | $78,750 | $18,200 | $60,550 |
| 2017 | $4,653 | $78,750 | $18,200 | $60,550 |
| 2016 | $4,471 | $66,640 | $11,340 | $55,300 |
| 2015 | $4,065 | $66,640 | $11,340 | $55,300 |
| 2014 | $4,075 | $66,640 | $11,340 | $55,300 |
| 2013 | $1,826 | $60,550 | $10,290 | $50,260 |
Source: Public Records
Map
Nearby Homes
- 23 E Maynard Ave
- 6 E Blake Ave
- 68 E Oakland Ave
- 210 E Blake Ave
- 2394 Neil Ave
- 2343 Indianola Ave
- 9 E Norwich Ave Unit 15
- 2458- 2458 1 2 Deming Ave
- 2478-2480 Deming Ave
- 2540 Neil Ave
- 2470 Indianola Ave
- 2362 Indiana Ave
- 2395 Summit St Unit 397
- 74 E Dodridge St
- 109 E Arcadia Ave
- 2683 Neil Ave Unit 685
- 2717 Hibbert Ave
- 2295 N 4th St
- 2555 Glenmawr Ave
- 2210-2212 N 4th St
- 82 E Maynard Ave Unit 84
- 82-84 E Maynard Ave
- 72 E Maynard Ave
- 88 E Maynard Ave
- 66 E Maynard Ave Unit 68
- 66 E Maynard Ave Unit 2
- 2393 Findley Ave Unit 395
- 2393-2395 Findley Ave
- 2393 Findley Ave Unit 95
- 60 E Maynard Ave Unit 62
- 2403 Findley Ave
- 56 E Maynard Ave Unit 58
- 67 E Maynard Ave
- 67 E Maynard Ave Unit 67 E Maynard
- 2398 East Ave
- 2392 Findley Ave
- 98 E Maynard Ave
- 73 E Maynard Ave
- 2402 East Ave
- 85 E Blake Ave
Your Personal Tour Guide
Ask me questions while you tour the home.