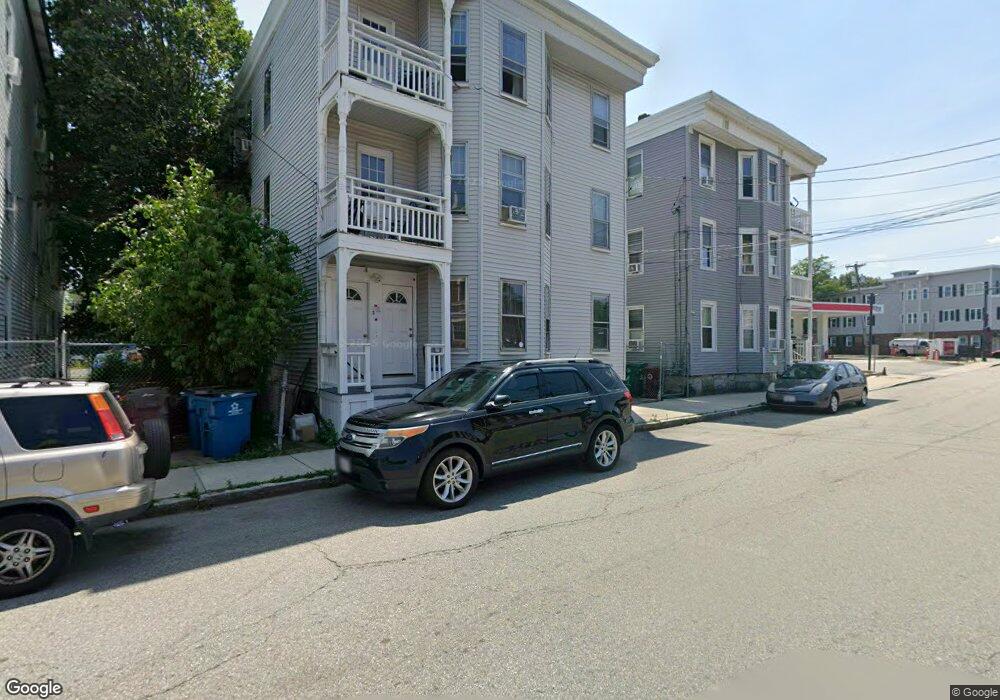
76 Elm St Lowell, MA 01852
Back Central NeighborhoodEstimated Value: $705,000 - $833,000
9
Beds
3
Baths
3,417
Sq Ft
$220/Sq Ft
Est. Value
About This Home
This home is located at 76 Elm St, Lowell, MA 01852 and is currently estimated at $751,000, approximately $219 per square foot. 76 Elm St is a home located in Middlesex County with nearby schools including Moody Elementary School, Abraham Lincoln Elementary School, and Greenhalge Elementary School.
Ownership History
Date
Name
Owned For
Owner Type
Purchase Details
Closed on
Apr 2, 2015
Sold by
Nelson Properties Llc
Bought by
Bcs Properties Llc
Current Estimated Value
Home Financials for this Owner
Home Financials are based on the most recent Mortgage that was taken out on this home.
Original Mortgage
$2,000,000
Outstanding Balance
$1,531,284
Interest Rate
3.75%
Mortgage Type
Purchase Money Mortgage
Estimated Equity
-$780,284
Purchase Details
Closed on
Jul 31, 2012
Sold by
Oliveira Nelson
Bought by
Nelson Properties Llc
Home Financials for this Owner
Home Financials are based on the most recent Mortgage that was taken out on this home.
Original Mortgage
$465,600
Interest Rate
3.74%
Mortgage Type
New Conventional
Purchase Details
Closed on
Jun 11, 2010
Sold by
Us Bk
Bought by
Oliveira Nelson
Purchase Details
Closed on
Jan 22, 2007
Sold by
Rivera Angel and Greenpoint Mtg Funding
Bought by
Wachovia Bk Na
Purchase Details
Closed on
Feb 17, 2004
Sold by
Webster Frederick L and Webster Theresa M
Bought by
Rivera Angel and Corchado Nancy
Create a Home Valuation Report for This Property
The Home Valuation Report is an in-depth analysis detailing your home's value as well as a comparison with similar homes in the area
Home Values in the Area
Average Home Value in this Area
Purchase History
| Date | Buyer | Sale Price | Title Company |
|---|---|---|---|
| Bcs Properties Llc | -- | -- | |
| Bcs Properties Llc | -- | -- | |
| Nelson Properties Llc | -- | -- | |
| Nelson Properties Llc | -- | -- | |
| Nelson Properties Llc | -- | -- | |
| Oliveira Nelson | $84,000 | -- | |
| Oliveira Nelson | $84,000 | -- | |
| Us Bk | -- | -- | |
| Wachovia Bk Na | $342,032 | -- | |
| Wachovia Bk Na | $342,032 | -- | |
| Rivera Angel | $275,000 | -- | |
| Rivera Angel | $275,000 | -- |
Source: Public Records
Mortgage History
| Date | Status | Borrower | Loan Amount |
|---|---|---|---|
| Open | Bcs Properties Llc | $2,000,000 | |
| Closed | Rivera Angel | $2,000,000 | |
| Previous Owner | Nelson Properties Llc | $465,600 |
Source: Public Records
Tax History Compared to Growth
Tax History
| Year | Tax Paid | Tax Assessment Tax Assessment Total Assessment is a certain percentage of the fair market value that is determined by local assessors to be the total taxable value of land and additions on the property. | Land | Improvement |
|---|---|---|---|---|
| 2025 | $6,623 | $576,900 | $98,000 | $478,900 |
| 2024 | $6,274 | $526,800 | $88,400 | $438,400 |
| 2023 | $6,160 | $496,000 | $76,800 | $419,200 |
| 2022 | $5,601 | $441,400 | $60,600 | $380,800 |
| 2021 | $4,831 | $358,900 | $52,700 | $306,200 |
| 2020 | $4,307 | $322,400 | $43,900 | $278,500 |
| 2019 | $4,183 | $297,900 | $40,700 | $257,200 |
| 2018 | $3,798 | $263,900 | $38,700 | $225,200 |
| 2017 | $3,703 | $248,200 | $42,200 | $206,000 |
| 2016 | $3,476 | $229,300 | $42,500 | $186,800 |
| 2015 | $3,286 | $212,300 | $42,500 | $169,800 |
| 2013 | $2,847 | $189,700 | $49,000 | $140,700 |
Source: Public Records
Map
Nearby Homes
- 70 Elm St
- 42 Keene St
- 12 Cedar St
- 8 Cherry St
- 834 Central St
- 15 Whipple St
- 43 Cedar St
- 8 Cedar Ct
- 24 Richmond Ave
- 46 Lyons St
- 39 Groves Ave
- 31 Merrill St
- 195 Thorndike St Unit 4
- 9 Watson St
- 201 Thorndike St Unit 2-05
- 201 Thorndike St Unit 501
- 201 Thorndike St Unit 2-312
- 14 Watson St Unit 4
- 540 Lawrence St
- 762 Gorham St Unit 3