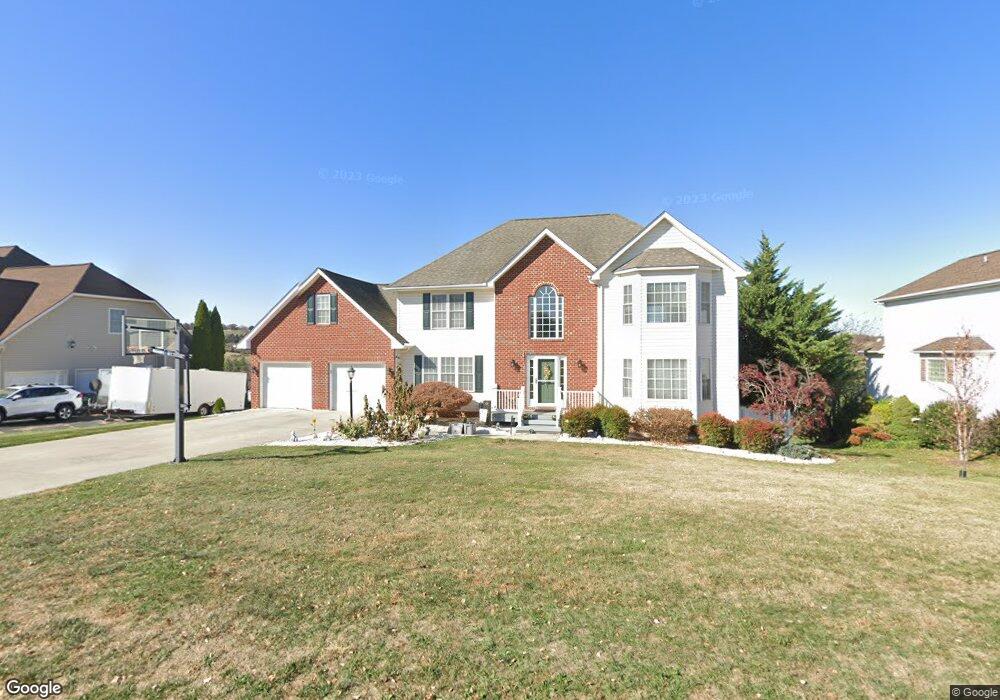
76 Emerald Hill Dr Fishersville, VA 22939
Estimated Value: $572,465 - $651,000
5
Beds
5
Baths
4,304
Sq Ft
$142/Sq Ft
Est. Value
About This Home
This home is located at 76 Emerald Hill Dr, Fishersville, VA 22939 and is currently estimated at $612,616, approximately $142 per square foot. 76 Emerald Hill Dr is a home located in Augusta County with nearby schools including Wilson Elementary School, Wilson Middle School, and Wilson Memorial High School.
Ownership History
Date
Name
Owned For
Owner Type
Purchase Details
Closed on
Jan 22, 2021
Sold by
Equity T Co
Bought by
R & L Property Llc
Current Estimated Value
Purchase Details
Closed on
Apr 24, 2018
Sold by
Trenbeath Laura
Bought by
Lana Abdulaev Ramin and Lana Abdulaeva
Home Financials for this Owner
Home Financials are based on the most recent Mortgage that was taken out on this home.
Original Mortgage
$296,000
Interest Rate
4.44%
Mortgage Type
Purchase Money Mortgage
Purchase Details
Closed on
Dec 10, 2014
Sold by
Herring David S
Bought by
Trenbeath Laura
Purchase Details
Closed on
Nov 24, 2008
Sold by
Watkins Mark E and Watkins Michelke H
Bought by
Herring David S
Home Financials for this Owner
Home Financials are based on the most recent Mortgage that was taken out on this home.
Original Mortgage
$260,000
Interest Rate
6.21%
Mortgage Type
New Conventional
Create a Home Valuation Report for This Property
The Home Valuation Report is an in-depth analysis detailing your home's value as well as a comparison with similar homes in the area
Home Values in the Area
Average Home Value in this Area
Purchase History
| Date | Buyer | Sale Price | Title Company |
|---|---|---|---|
| R & L Property Llc | -- | None Available | |
| Lana Abdulaev Ramin | $370,000 | -- | |
| Trenbeath Laura | $360,000 | Attorney | |
| Herring David S | -- | -- |
Source: Public Records
Mortgage History
| Date | Status | Borrower | Loan Amount |
|---|---|---|---|
| Previous Owner | Lana Abdulaev Ramin | $296,000 | |
| Previous Owner | Herring David S | $260,000 |
Source: Public Records
Tax History Compared to Growth
Tax History
| Year | Tax Paid | Tax Assessment Tax Assessment Total Assessment is a certain percentage of the fair market value that is determined by local assessors to be the total taxable value of land and additions on the property. | Land | Improvement |
|---|---|---|---|---|
| 2025 | $3,015 | $579,900 | $65,000 | $514,900 |
| 2024 | $3,277 | $630,100 | $65,000 | $565,100 |
| 2023 | $2,561 | $406,500 | $60,000 | $346,500 |
| 2022 | $2,561 | $406,500 | $60,000 | $346,500 |
| 2021 | $2,561 | $406,500 | $60,000 | $346,500 |
| 2020 | $2,561 | $406,500 | $60,000 | $346,500 |
| 2019 | $2,561 | $406,500 | $60,000 | $346,500 |
| 2018 | $2,375 | $376,967 | $60,000 | $316,967 |
| 2017 | $2,187 | $376,967 | $60,000 | $316,967 |
| 2016 | $2,187 | $376,967 | $60,000 | $316,967 |
| 2015 | $1,795 | $376,967 | $60,000 | $316,967 |
| 2014 | $1,795 | $376,967 | $60,000 | $316,967 |
| 2013 | $1,795 | $373,900 | $60,000 | $313,900 |
Source: Public Records
Map
Nearby Homes
- 5 Hidden Valley Ct
- 49 Johns Valley Dr
- 48 Lillian Dr
- 88 Johns Valley Dr
- 9 S Cobblestone Ct
- 37 Oxford Rd
- 96 Harrogate Dr
- 194 Kiddsville Rd
- 30 New Brunswick Rd
- 12 Abbey Ct Unit 13
- 58 Enchanted View Cir
- 0 Long Meadow Rd Unit 651287
- 38 J Ranch Ln
- 243 Barrenridge Rd
- 1197 Entry School Rd
- 20 Dirby Way
- 757 Entry School Rd
- 260 Windsor Dr
- 47 S Windsong Ct
- 290 Windsor Dr
- 84 Emerald Hill Dr
- 70 Emerald Hill Dr
- TBD Emerald Hill Dr
- 77 Emerald Hill Dr
- 90 Emerald Hill Dr
- 69 Emerald Hill Dr
- 83 Emerald Hill Dr
- 62 Emerald Hill Dr
- 8 Emerald Heights Dr
- 91 Emerald Hill Dr
- 100 Emerald Hill Dr
- 52 Emerald Hill Dr
- 99 Emerald Hill Dr
- 17 Hidden Valley Ct
- 13 Hidden Valley Ct
- 20 Emerald Heights Dr
- 108 Emerald Hill Dr
- 46 Emerald Hill Dr
- 9 Emerald Heights Dr
- 635 Long Meadow Rd