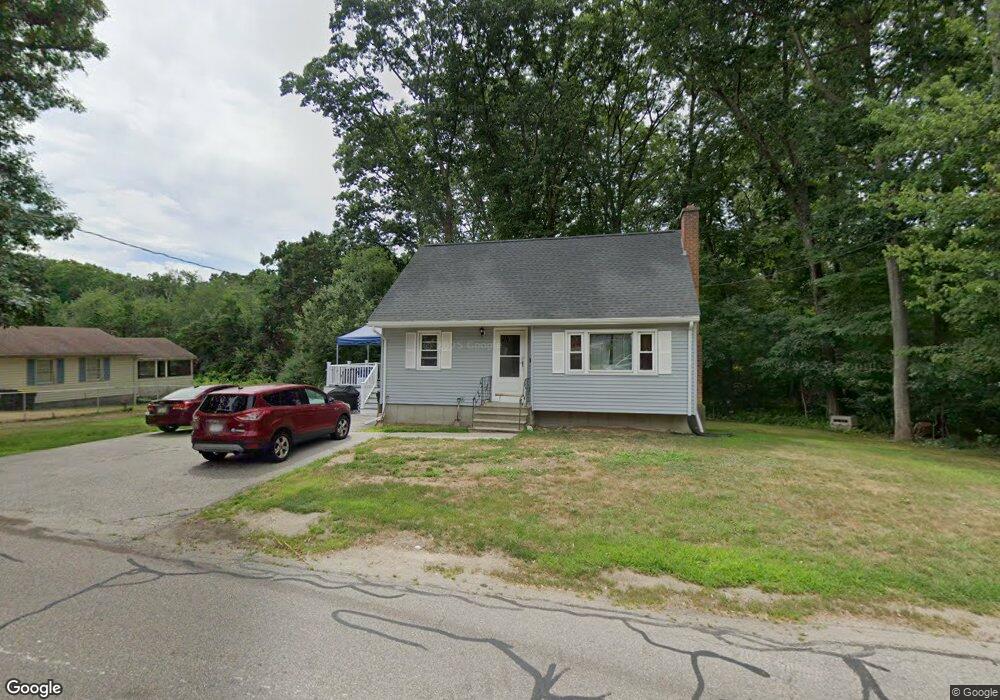
76 Farm St Bellingham, MA 02019
Estimated Value: $436,000 - $475,471
3
Beds
2
Baths
1,028
Sq Ft
$451/Sq Ft
Est. Value
About This Home
This home is located at 76 Farm St, Bellingham, MA 02019 and is currently estimated at $463,368, approximately $450 per square foot. 76 Farm St is a home located in Norfolk County with nearby schools including Stall Brook Elementary School, Bellingham High School, and Bethany Christian Academy.
Ownership History
Date
Name
Owned For
Owner Type
Purchase Details
Closed on
Aug 30, 2001
Sold by
Biddy Edward J and Biddy Diane M
Bought by
Morreale Edward and Morreale Anne M
Current Estimated Value
Home Financials for this Owner
Home Financials are based on the most recent Mortgage that was taken out on this home.
Original Mortgage
$132,000
Outstanding Balance
$51,735
Interest Rate
7.06%
Mortgage Type
Purchase Money Mortgage
Estimated Equity
$411,633
Purchase Details
Closed on
Jun 2, 1989
Sold by
Kerr Daniel J
Bought by
Biddy Edward L
Home Financials for this Owner
Home Financials are based on the most recent Mortgage that was taken out on this home.
Original Mortgage
$40,000
Interest Rate
10.93%
Create a Home Valuation Report for This Property
The Home Valuation Report is an in-depth analysis detailing your home's value as well as a comparison with similar homes in the area
Home Values in the Area
Average Home Value in this Area
Purchase History
| Date | Buyer | Sale Price | Title Company |
|---|---|---|---|
| Morreale Edward | $155,000 | -- | |
| Biddy Edward L | $90,000 | -- |
Source: Public Records
Mortgage History
| Date | Status | Borrower | Loan Amount |
|---|---|---|---|
| Open | Biddy Edward L | $132,000 | |
| Previous Owner | Biddy Edward L | $80,000 | |
| Previous Owner | Biddy Edward L | $40,000 | |
| Previous Owner | Biddy Edward L | $80,000 |
Source: Public Records
Tax History
| Year | Tax Paid | Tax Assessment Tax Assessment Total Assessment is a certain percentage of the fair market value that is determined by local assessors to be the total taxable value of land and additions on the property. | Land | Improvement |
|---|---|---|---|---|
| 2025 | $4,733 | $376,800 | $172,700 | $204,100 |
| 2024 | $4,514 | $351,000 | $157,700 | $193,300 |
| 2023 | $4,352 | $333,500 | $150,200 | $183,300 |
| 2022 | $4,107 | $291,700 | $125,400 | $166,300 |
| 2021 | $4,018 | $278,800 | $125,400 | $153,400 |
| 2020 | $3,802 | $267,400 | $125,400 | $142,000 |
| 2019 | $3,729 | $262,400 | $125,400 | $137,000 |
| 2018 | $3,443 | $238,900 | $120,600 | $118,300 |
| 2017 | $3,367 | $234,800 | $120,600 | $114,200 |
| 2016 | $3,232 | $226,200 | $118,600 | $107,600 |
| 2015 | $3,099 | $217,500 | $114,100 | $103,400 |
| 2014 | $3,112 | $212,300 | $111,400 | $100,900 |
Source: Public Records
Map
Nearby Homes
- 0 Hixon St Unit 73477486
- 67 Jeannine Rd
- 60 Wethersfield Rd
- 48 Donna Rd
- 48 Black Bear Cir Unit 48
- 46 Black Bear Cir Unit 46
- 43 Black Bear Cir Unit 43
- 3 Black Bear Cir Unit 3
- 7 Black Bear Unit 7
- 9 Black Bear Cir Unit 9
- 11 Black Bear Unit 11
- 13 Black Bear Cir Unit 13
- 8 Black Bear Cir Unit 8
- 15 Black Bear Cir Unit 15
- 10 Black Bear Unit 10
- 17 Pine St
- 44 Arapahoe Rd
- 22 Granite St
- 15 Fox Run Rd
- 0 Hartford Ave
Your Personal Tour Guide
Ask me questions while you tour the home.