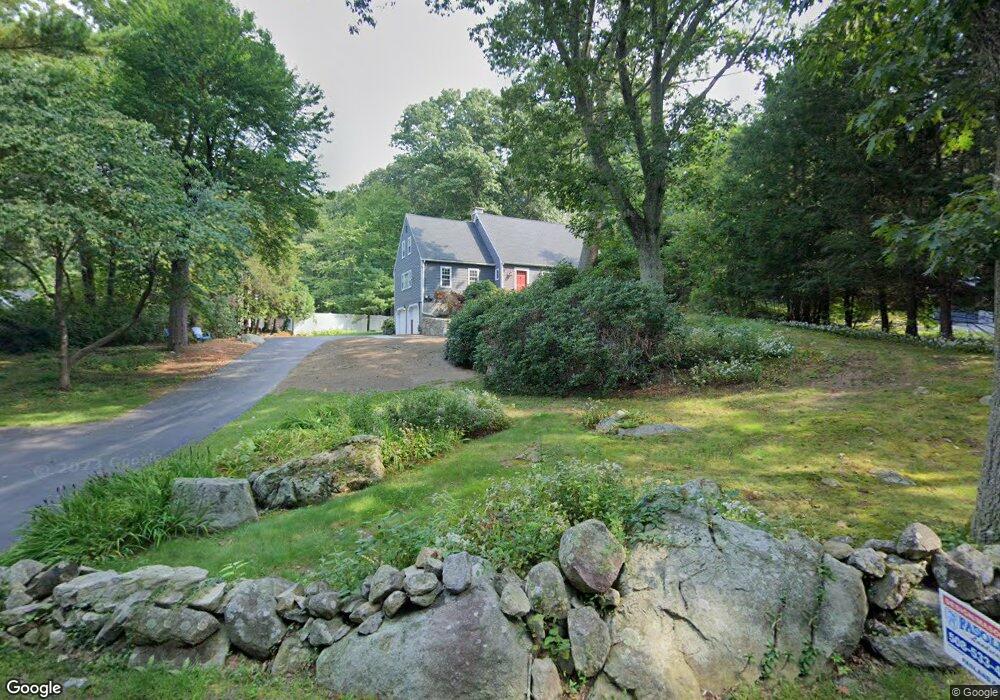
76 Fisher St Medway, MA 02053
Estimated Value: $682,807 - $838,000
4
Beds
3
Baths
2,258
Sq Ft
$326/Sq Ft
Est. Value
About This Home
This home is located at 76 Fisher St, Medway, MA 02053 and is currently estimated at $736,202, approximately $326 per square foot. 76 Fisher St is a home located in Norfolk County with nearby schools including John D. McGovern Elementary School, Burke-Memorial Elementary, and Medway Middle School.
Ownership History
Date
Name
Owned For
Owner Type
Purchase Details
Closed on
Oct 10, 2014
Sold by
Sigl Penelope A
Bought by
Penelope A Sigl T and Sigl Penelope A
Current Estimated Value
Purchase Details
Closed on
Jun 1, 1994
Sold by
Conrad Edward C and Conrad Irene A
Bought by
Sigl Jeffrey C and Sigl Penelope A
Home Financials for this Owner
Home Financials are based on the most recent Mortgage that was taken out on this home.
Original Mortgage
$168,000
Interest Rate
8.49%
Mortgage Type
Purchase Money Mortgage
Create a Home Valuation Report for This Property
The Home Valuation Report is an in-depth analysis detailing your home's value as well as a comparison with similar homes in the area
Home Values in the Area
Average Home Value in this Area
Purchase History
| Date | Buyer | Sale Price | Title Company |
|---|---|---|---|
| Penelope A Sigl T | -- | -- | |
| Sigl Jeffrey C | $210,000 | -- |
Source: Public Records
Mortgage History
| Date | Status | Borrower | Loan Amount |
|---|---|---|---|
| Previous Owner | Sigl Jeffrey C | $131,000 | |
| Previous Owner | Sigl Jeffrey C | $162,000 | |
| Previous Owner | Sigl Jeffrey C | $166,000 | |
| Previous Owner | Sigl Jeffrey C | $168,000 |
Source: Public Records
Tax History Compared to Growth
Tax History
| Year | Tax Paid | Tax Assessment Tax Assessment Total Assessment is a certain percentage of the fair market value that is determined by local assessors to be the total taxable value of land and additions on the property. | Land | Improvement |
|---|---|---|---|---|
| 2025 | $7,590 | $532,600 | $295,800 | $236,800 |
| 2024 | $7,669 | $532,600 | $295,800 | $236,800 |
| 2023 | $7,329 | $459,800 | $245,100 | $214,700 |
| 2022 | $7,287 | $430,400 | $217,600 | $212,800 |
| 2021 | $6,864 | $393,100 | $200,700 | $192,400 |
| 2020 | $6,561 | $374,900 | $186,000 | $188,900 |
| 2019 | $6,391 | $376,600 | $186,000 | $190,600 |
| 2018 | $6,170 | $349,400 | $160,600 | $188,800 |
| 2017 | $6,621 | $369,500 | $186,000 | $183,500 |
| 2016 | $6,424 | $354,700 | $171,200 | $183,500 |
| 2015 | $6,616 | $362,700 | $169,000 | $193,700 |
| 2014 | $6,477 | $343,800 | $169,000 | $174,800 |
Source: Public Records
Map
Nearby Homes
- 78 Fisher St
- 4 Deerfield Rd
- 85 Fisher St
- 6 Rainbow Dr
- 22 Granite St
- 9 Tulip Way
- 39 West St
- 15 Broad Acres Farm Rd
- 6 Freedom Trail
- 12 Longmeadow Ln
- 462 Hartford Ave
- 5 Fales St
- 0 Old Log Lane (Farm St) Unit 73416329
- 220 Main St Unit 220
- 455 Hartford Ave
- 56 Paul Rd
- 176 Main St Unit 3
- 387 Hartford Ave
- 28 Wellington St
- 11 Black Bear Unit 11