Estimated Value: $473,000 - $551,000
2
Beds
1
Bath
1,248
Sq Ft
$408/Sq Ft
Est. Value
About This Home
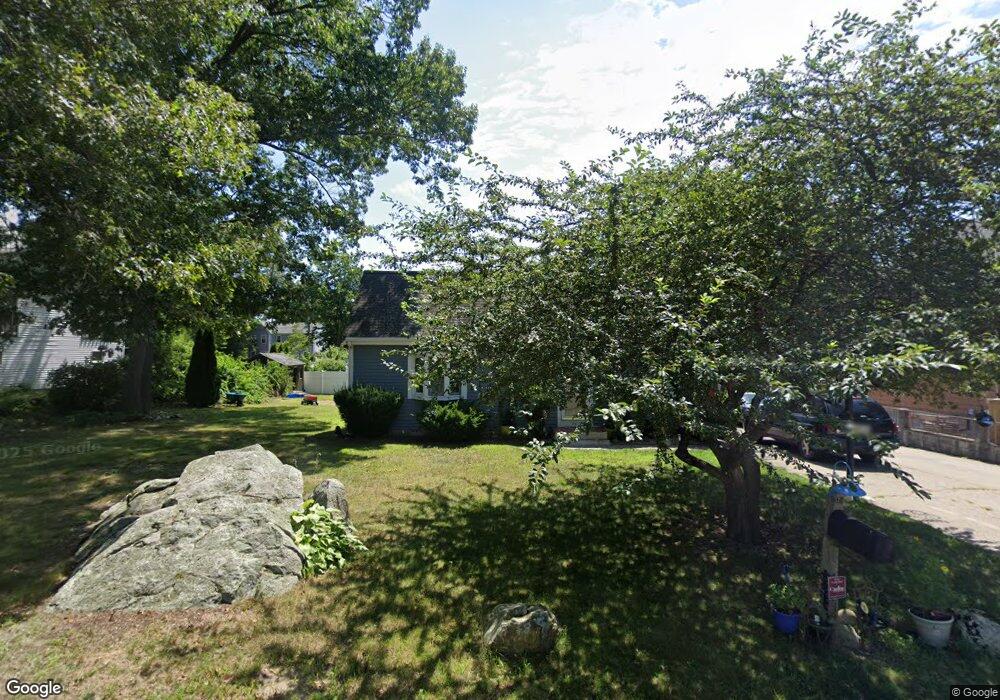
This home is located at 76 Highland St, Avon, MA 02322 and is currently estimated at $508,591, approximately $407 per square foot. 76 Highland St is a home located in Norfolk County with nearby schools including Ralph D. Butler Elementary School and Avon Middle/High School.
Ownership History
Date
Name
Owned For
Owner Type
Purchase Details
Closed on
Nov 18, 2002
Sold by
Vaughn Bryan R and Vaughn Joanne K
Bought by
Matos Sandra
Current Estimated Value
Home Financials for this Owner
Home Financials are based on the most recent Mortgage that was taken out on this home.
Original Mortgage
$247,660
Outstanding Balance
$103,810
Interest Rate
6.03%
Mortgage Type
Purchase Money Mortgage
Estimated Equity
$404,781
Purchase Details
Closed on
May 31, 1988
Sold by
Rogers John F
Bought by
Vaughn Bryan R
Home Financials for this Owner
Home Financials are based on the most recent Mortgage that was taken out on this home.
Original Mortgage
$124,200
Interest Rate
10.18%
Mortgage Type
Purchase Money Mortgage
Create a Home Valuation Report for This Property
The Home Valuation Report is an in-depth analysis detailing your home's value as well as a comparison with similar homes in the area
Home Values in the Area
Average Home Value in this Area
Purchase History
| Date | Buyer | Sale Price | Title Company |
|---|---|---|---|
| Matos Sandra | $250,900 | -- | |
| Vaughn Bryan R | $138,000 | -- |
Source: Public Records
Mortgage History
| Date | Status | Borrower | Loan Amount |
|---|---|---|---|
| Open | Matos Sandra | $247,660 | |
| Previous Owner | Vaughn Bryan R | $112,800 | |
| Previous Owner | Vaughn Bryan R | $124,200 |
Source: Public Records
Tax History Compared to Growth
Tax History
| Year | Tax Paid | Tax Assessment Tax Assessment Total Assessment is a certain percentage of the fair market value that is determined by local assessors to be the total taxable value of land and additions on the property. | Land | Improvement |
|---|---|---|---|---|
| 2025 | $54 | $408,300 | $208,700 | $199,600 |
| 2024 | $4,958 | $353,400 | $189,300 | $164,100 |
| 2023 | $4,813 | $353,400 | $189,300 | $164,100 |
| 2022 | $4,863 | $307,600 | $157,800 | $149,800 |
| 2021 | $4,460 | $265,800 | $143,100 | $122,700 |
| 2020 | $5,009 | $283,000 | $140,300 | $142,700 |
| 2019 | $4,499 | $250,100 | $133,900 | $116,200 |
| 2018 | $4,582 | $247,000 | $133,900 | $113,100 |
| 2017 | $4,187 | $242,300 | $133,900 | $108,400 |
| 2016 | $3,865 | $225,900 | $127,500 | $98,400 |
| 2015 | $3,531 | $215,700 | $121,700 | $94,000 |
Source: Public Records
Map
Nearby Homes