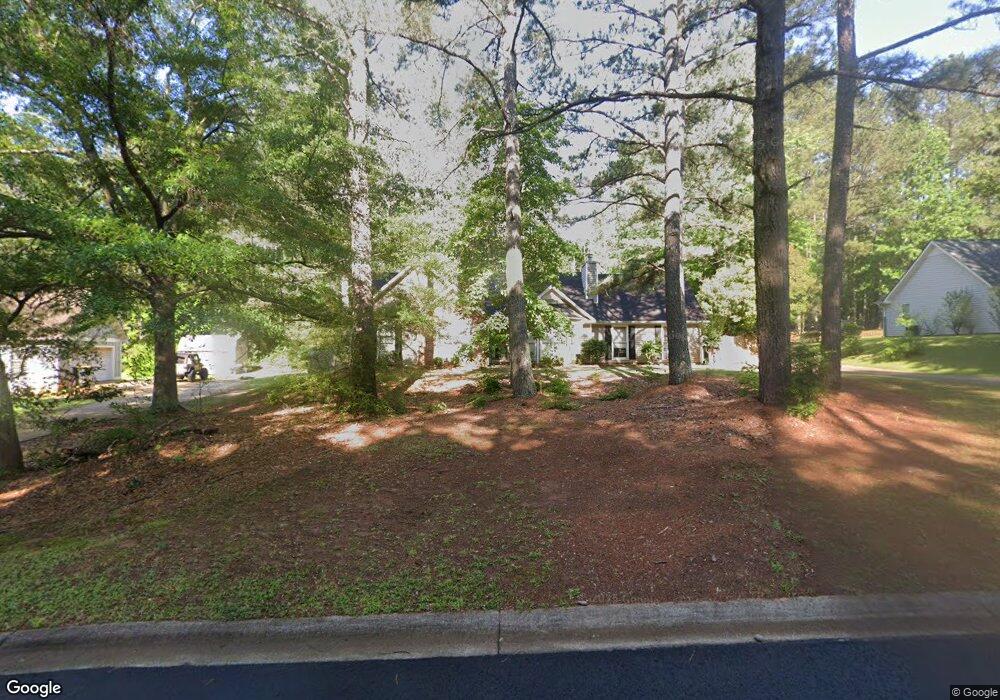
76 Jeb Stuart Dr Newnan, GA 30265
Estimated Value: $301,277 - $342,000
3
Beds
2
Baths
1,722
Sq Ft
$190/Sq Ft
Est. Value
About This Home
This home is located at 76 Jeb Stuart Dr, Newnan, GA 30265 and is currently estimated at $327,569, approximately $190 per square foot. 76 Jeb Stuart Dr is a home located in Coweta County with nearby schools including White Oak Elementary School, Arnall Middle School, and Northgate High School.
Ownership History
Date
Name
Owned For
Owner Type
Purchase Details
Closed on
Jan 31, 2007
Sold by
Paschall Vallerie L
Bought by
Turk Beverly and Cooper Sondi
Current Estimated Value
Home Financials for this Owner
Home Financials are based on the most recent Mortgage that was taken out on this home.
Original Mortgage
$152,604
Outstanding Balance
$90,945
Interest Rate
6.07%
Mortgage Type
FHA
Estimated Equity
$236,624
Purchase Details
Closed on
May 28, 1999
Sold by
Vidal Jose A and Vidal Lauren H
Bought by
Paschall Valerie L
Home Financials for this Owner
Home Financials are based on the most recent Mortgage that was taken out on this home.
Original Mortgage
$90,100
Interest Rate
9.75%
Mortgage Type
New Conventional
Purchase Details
Closed on
Jun 14, 1995
Sold by
High Point Prop
Bought by
Vidal Jose Lauren
Purchase Details
Closed on
Mar 2, 1995
Bought by
High Point Propertie
Purchase Details
Closed on
Apr 16, 1991
Bought by
Widewater Inc
Create a Home Valuation Report for This Property
The Home Valuation Report is an in-depth analysis detailing your home's value as well as a comparison with similar homes in the area
Home Values in the Area
Average Home Value in this Area
Purchase History
| Date | Buyer | Sale Price | Title Company |
|---|---|---|---|
| Turk Beverly | $153,900 | -- | |
| Paschall Valerie L | $106,000 | -- | |
| Paschall Valerie L | -- | -- | |
| Vidal Jose Lauren | $79,800 | -- | |
| High Point Propertie | $16,000 | -- | |
| Widewater Inc | $502,400 | -- |
Source: Public Records
Mortgage History
| Date | Status | Borrower | Loan Amount |
|---|---|---|---|
| Open | Turk Beverly | $152,604 | |
| Previous Owner | Paschall Valerie L | $90,100 | |
| Closed | Vidal Jose Lauren | $0 |
Source: Public Records
Tax History Compared to Growth
Tax History
| Year | Tax Paid | Tax Assessment Tax Assessment Total Assessment is a certain percentage of the fair market value that is determined by local assessors to be the total taxable value of land and additions on the property. | Land | Improvement |
|---|---|---|---|---|
| 2024 | $795 | $105,491 | $22,000 | $83,491 |
| 2023 | $795 | $107,238 | $18,000 | $89,238 |
| 2022 | $754 | $91,427 | $18,000 | $73,427 |
| 2021 | $690 | $79,570 | $18,000 | $61,570 |
| 2020 | $587 | $68,426 | $14,000 | $54,426 |
| 2019 | $606 | $61,982 | $12,000 | $49,982 |
| 2018 | $610 | $61,982 | $12,000 | $49,982 |
| 2017 | $545 | $55,908 | $10,000 | $45,908 |
| 2016 | $483 | $51,496 | $10,000 | $41,496 |
| 2015 | $403 | $45,725 | $10,000 | $35,725 |
| 2014 | $325 | $43,725 | $8,000 | $35,725 |
Source: Public Records
Map
Nearby Homes
- 10 Baker Rd
- 35 Pinehaven Dr
- 2342 Highway 34 E
- 1018 Sullivan Rd
- 2342 Ga-34
- 0 Green Terrace Unit 10546475
- 0 Forest Berry Ct Unit LT80M2A 10293886
- 0 Forest Berry Ct Unit LT77M2A 10293871
- 0 Forest Berry Ct Unit LT76M2A 10293833
- 0 Forest Berry Ct Unit LT71M2A 10292471
- 208 Daybreak Ln
- 210 Daybreak Ln
- 214 Daybreak Ln
- 14.54 ACRES Georgia 34
- 63A Georgia 34
- 45 Burwick Ct Unit 13
- 6 Leverett Dr Unit 17
- 280 Northcrest Dr
- 77 Springfield Ct
- 45 Sullivan Landing
- 90 Jeb Stuart Dr
- 64 Jeb Stuart Dr Unit 104
- 64 Jeb Stuart Dr
- 83 Jeb Stuart Dr
- 100 Jeb Stuart Dr
- 95 Jeb Stuart Dr
- 54 Jeb Stuart Dr
- 54 Jeb Stuart Dr Unit 105
- 53 Jeb Stuart Dr
- 105 Jeb Stuart Dr
- 110 Jeb Stuart Dr
- 41 Jeb Stuart Dr
- 117 Jeb Stuart Dr
- 124 Jeb Stuart Dr
- 20 Jerdon Ct Unit 2
- 24 Eastwood Dr
- 131 Jeb Stuart Dr
- 134 Jeb Stuart Dr
- 25 Eastwood Dr
- 141 Jeb Stuart Dr