Estimated Value: $277,000 - $306,000
3
Beds
2
Baths
1,846
Sq Ft
$159/Sq Ft
Est. Value
About This Home
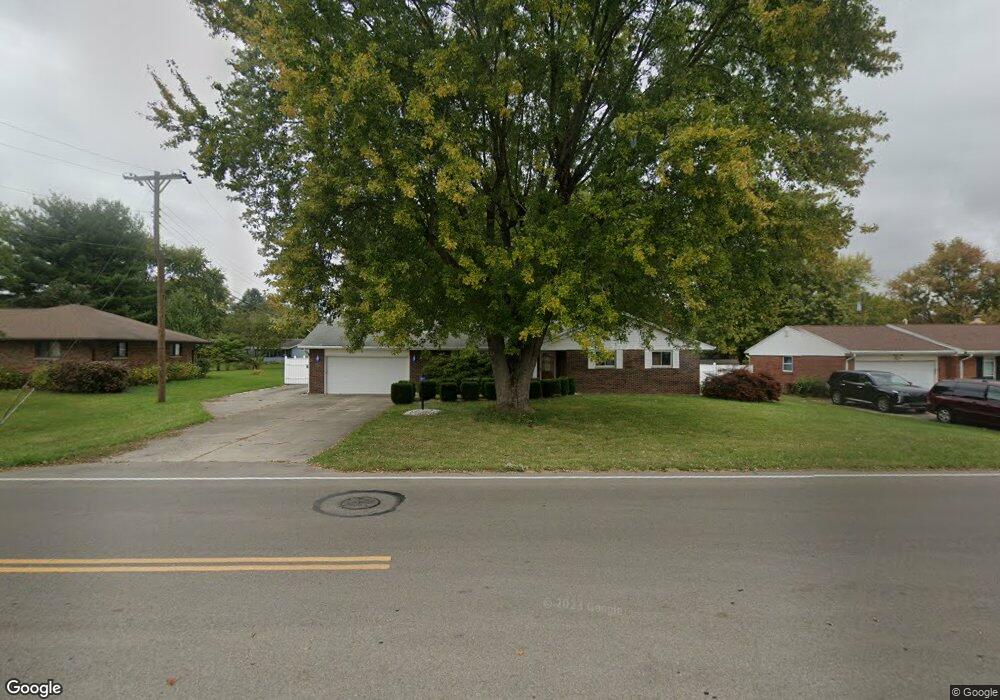
This home is located at 76 Kinsey Rd, Xenia, OH 45385 and is currently estimated at $293,441, approximately $158 per square foot. 76 Kinsey Rd is a home located in Greene County with nearby schools including Xenia High School and Summit Academy Community School for Alternative Learners - Xenia.
Ownership History
Date
Name
Owned For
Owner Type
Purchase Details
Closed on
Jul 8, 2022
Sold by
Underwood Gayle E
Bought by
Underwood Gayle E and Underwood Keith Kevin
Current Estimated Value
Purchase Details
Closed on
Jun 12, 2013
Sold by
Secrest Reneia L
Bought by
Underwood Gayle E
Home Financials for this Owner
Home Financials are based on the most recent Mortgage that was taken out on this home.
Original Mortgage
$139,500
Interest Rate
3.43%
Mortgage Type
Unknown
Purchase Details
Closed on
Feb 2, 2006
Sold by
Estate Of Mark D Secrest
Bought by
Secrest Reneia L
Purchase Details
Closed on
Sep 19, 2003
Sold by
Harrison William Kenneth
Bought by
Secrest Mark D and Secrest Reneia
Home Financials for this Owner
Home Financials are based on the most recent Mortgage that was taken out on this home.
Original Mortgage
$106,000
Interest Rate
6.33%
Mortgage Type
Unknown
Create a Home Valuation Report for This Property
The Home Valuation Report is an in-depth analysis detailing your home's value as well as a comparison with similar homes in the area
Home Values in the Area
Average Home Value in this Area
Purchase History
| Date | Buyer | Sale Price | Title Company |
|---|---|---|---|
| Underwood Gayle E | -- | Stephan Peter D | |
| Underwood Gayle E | $155,000 | None Available | |
| Secrest Reneia L | -- | None Available | |
| Secrest Mark D | $212,000 | -- |
Source: Public Records
Mortgage History
| Date | Status | Borrower | Loan Amount |
|---|---|---|---|
| Previous Owner | Underwood Gayle E | $139,500 | |
| Previous Owner | Secrest Mark D | $106,000 |
Source: Public Records
Tax History Compared to Growth
Tax History
| Year | Tax Paid | Tax Assessment Tax Assessment Total Assessment is a certain percentage of the fair market value that is determined by local assessors to be the total taxable value of land and additions on the property. | Land | Improvement |
|---|---|---|---|---|
| 2024 | $3,807 | $80,190 | $13,400 | $66,790 |
| 2023 | $3,807 | $80,190 | $13,400 | $66,790 |
| 2022 | $3,254 | $60,670 | $11,170 | $49,500 |
| 2021 | $3,295 | $60,670 | $11,170 | $49,500 |
| 2020 | $3,166 | $60,670 | $11,170 | $49,500 |
| 2019 | $2,767 | $49,770 | $10,010 | $39,760 |
| 2018 | $2,777 | $49,770 | $10,010 | $39,760 |
| 2017 | $2,102 | $49,770 | $10,010 | $39,760 |
| 2016 | $2,102 | $46,740 | $10,010 | $36,730 |
| 2015 | $2,108 | $46,740 | $10,010 | $36,730 |
| 2014 | $2,022 | $46,740 | $10,010 | $36,730 |
Source: Public Records
Map
Nearby Homes
- 15 Sexton Dr
- 2018 Tahoe Dr
- 965 Oak Dale Dr
- 2094 Malibu Trail
- 1968 El Camino Dr
- 1171 N Detroit St
- 1815 Promenade Ln
- 1872 Harris Ln
- 1359 Eagles Way
- 493 Hollywood Blvd
- 499 Hollywood Blvd
- 1038 Frederick Dr
- 1311 Eagles Way
- 2537 Ridge Rd
- 1791 Palmer Ct
- 1796 Palmer Ct
- 1802 Palmer Ct
- 1808 Palmer Ct
- 1820 Palmer Ct
- 1814 Palmer Ct