76 Lake View Ln Unit 59 Ellijay, GA 30536
Estimated Value: $472,740 - $654,000
3
Beds
3
Baths
2,238
Sq Ft
$241/Sq Ft
Est. Value
About This Home
This home is located at 76 Lake View Ln Unit 59, Ellijay, GA 30536 and is currently estimated at $539,935, approximately $241 per square foot. 76 Lake View Ln Unit 59 is a home located in Gilmer County with nearby schools including Ellijay Elementary School, Clear Creek Elementary School, and Clear Creek Middle School.
Ownership History
Date
Name
Owned For
Owner Type
Purchase Details
Closed on
Oct 26, 2017
Sold by
Webb Mary L
Bought by
Tarrou Carla and Tarrou John
Current Estimated Value
Home Financials for this Owner
Home Financials are based on the most recent Mortgage that was taken out on this home.
Original Mortgage
$162,000
Outstanding Balance
$135,676
Interest Rate
3.83%
Mortgage Type
New Conventional
Estimated Equity
$404,259
Purchase Details
Closed on
Aug 16, 2006
Sold by
Hiers David A
Bought by
Webb Joseph T and Webb Mary L
Home Financials for this Owner
Home Financials are based on the most recent Mortgage that was taken out on this home.
Original Mortgage
$201,000
Interest Rate
6.73%
Mortgage Type
New Conventional
Purchase Details
Closed on
Feb 3, 2000
Sold by
The River'S Edge Est
Bought by
Hiers David A
Create a Home Valuation Report for This Property
The Home Valuation Report is an in-depth analysis detailing your home's value as well as a comparison with similar homes in the area
Home Values in the Area
Average Home Value in this Area
Purchase History
| Date | Buyer | Sale Price | Title Company |
|---|---|---|---|
| Tarrou Carla | $262,000 | -- | |
| Webb Mary L | -- | -- | |
| Webb Joseph T | $270,000 | -- | |
| Hiers David A | $17,900 | -- |
Source: Public Records
Mortgage History
| Date | Status | Borrower | Loan Amount |
|---|---|---|---|
| Open | Webb Mary L | $162,000 | |
| Closed | Tarrou Carla | $162,000 | |
| Previous Owner | Webb Joseph T | $201,000 |
Source: Public Records
Tax History Compared to Growth
Tax History
| Year | Tax Paid | Tax Assessment Tax Assessment Total Assessment is a certain percentage of the fair market value that is determined by local assessors to be the total taxable value of land and additions on the property. | Land | Improvement |
|---|---|---|---|---|
| 2024 | $392 | $141,080 | $11,400 | $129,680 |
| 2023 | $403 | $140,880 | $11,200 | $129,680 |
| 2022 | $420 | $119,480 | $11,200 | $108,280 |
| 2021 | $466 | $90,280 | $6,000 | $84,280 |
| 2020 | $519 | $79,280 | $7,200 | $72,080 |
| 2019 | $1,644 | $79,280 | $7,200 | $72,080 |
| 2018 | $1,706 | $82,080 | $10,000 | $72,080 |
| 2017 | $514 | $66,240 | $10,000 | $56,240 |
| 2016 | $514 | $66,320 | $8,800 | $57,520 |
| 2015 | $1,535 | $62,280 | $8,800 | $53,480 |
| 2014 | $1,600 | $62,440 | $8,800 | $53,640 |
| 2013 | -- | $63,040 | $8,800 | $54,240 |
Source: Public Records
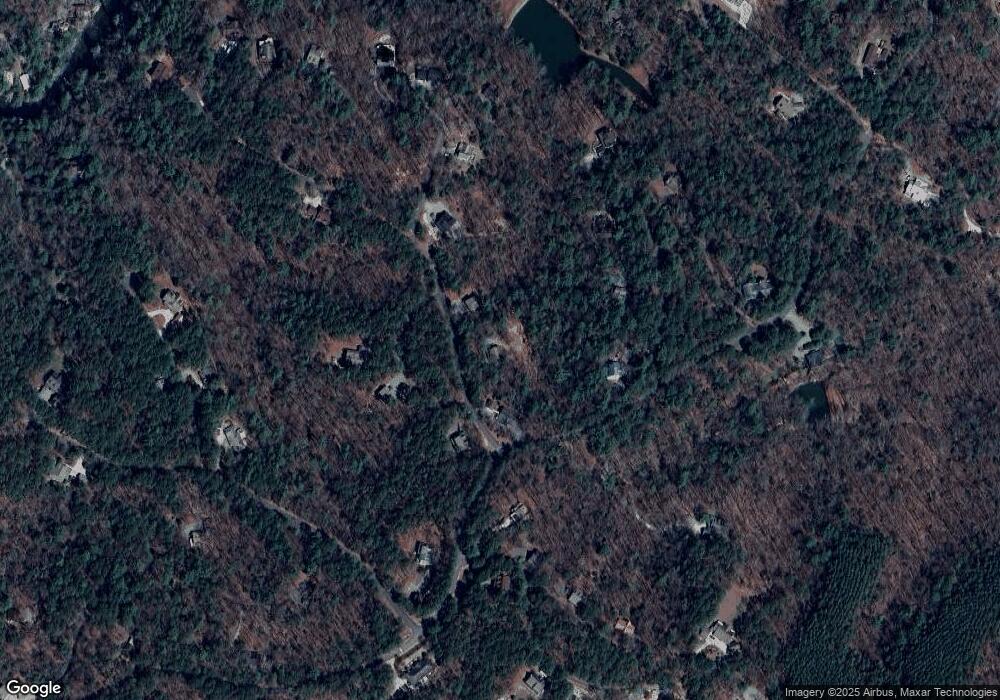
Map
Nearby Homes
- 50 Misty Oaks Ct
- 335 Misty Hollow Rd
- 143 Hidden Lake Cir
- 77 Long View Ln
- 1930 Blackberry Mountain Rd
- 44 Cartecay Ct
- 31&32 Fox Paw Leaf Ln
- LOT 26 Fox Paw Leaf Ln
- 0 Foxpaw Leaf Ln Unit LOT 20
- 0 Foxpaw Leaf Ln Unit 38
- 0 Foxpaw Leaf Ln Unit 7675080
- 0 Foxpaw Leaf Ln Unit 7675161
- 0 Oval Leaf Ln Unit 419179
- 105 Riveredge Dr
- LOT 10 Johnson Mill Rd
- 88 Pauls Ln
- 76 Lake View Ln
- 76 Lakeview Ln
- 96 Lake View Ln
- 96 Lake View Ln
- 28 Lakeview Ln
- 28 Lake View Ln
- 0 Lakeview Ln Unit 58 8422271
- 0 Lakeview Ln Unit 3148691
- 0 Lakeview Ln Unit 8398716
- 0 Lakeview Ln Unit 8558020
- 43 Lakeview Cir
- 33 Lakeview Cir
- 30 Lakeview Cir
- Lot 30 Lakeview Cir
- 7 Lake View Ln
- Lot 32 Lakeview Cir
- LOT30 Lakeview Cir
- 0 Lakeview Cir Unit 30 8239514
- 0 Lakeview Cir Unit 8598393
- 0 Lakeview Cir Unit 30 7586654