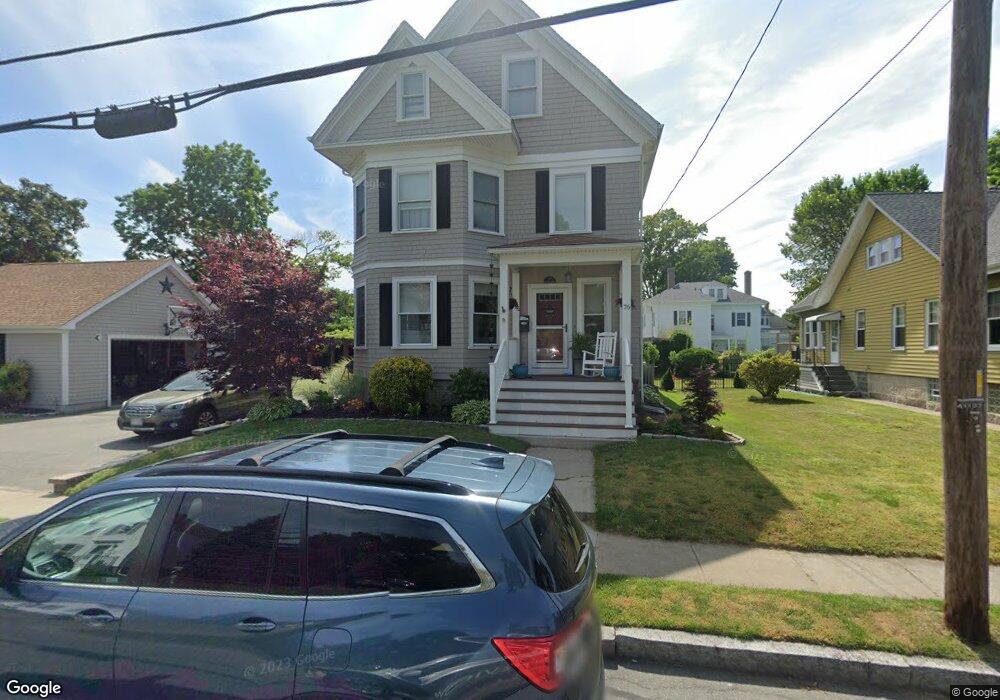
76 Laurel St Fairhaven, MA 02719
Estimated Value: $629,000 - $842,000
3
Beds
3
Baths
2,490
Sq Ft
$304/Sq Ft
Est. Value
About This Home
This home is located at 76 Laurel St, Fairhaven, MA 02719 and is currently estimated at $756,542, approximately $303 per square foot. 76 Laurel St is a home located in Bristol County with nearby schools including Fairhaven High School, City On A Hill Charter Public School New Bedford, and St. Joseph School.
Ownership History
Date
Name
Owned For
Owner Type
Purchase Details
Closed on
Mar 23, 2012
Sold by
Matrinho Antonio J and Matrinho Idalian G
Bought by
Matrinho Antonio J and Matrinho Idalian G
Current Estimated Value
Purchase Details
Closed on
Mar 17, 2010
Sold by
Brown David L and Brown Amy D
Bought by
Martinho Antonio J and Martinho Idalina G
Purchase Details
Closed on
Aug 7, 2006
Sold by
Ashley Allen C Jr Est and Ashley
Bought by
Brown Amy D and Brown David L
Home Financials for this Owner
Home Financials are based on the most recent Mortgage that was taken out on this home.
Original Mortgage
$283,900
Interest Rate
6.7%
Mortgage Type
Purchase Money Mortgage
Create a Home Valuation Report for This Property
The Home Valuation Report is an in-depth analysis detailing your home's value as well as a comparison with similar homes in the area
Home Values in the Area
Average Home Value in this Area
Purchase History
| Date | Buyer | Sale Price | Title Company |
|---|---|---|---|
| Matrinho Antonio J | $325,000 | -- | |
| Martinho Antonio J | $205,000 | -- | |
| Brown Amy D | $355,000 | -- |
Source: Public Records
Mortgage History
| Date | Status | Borrower | Loan Amount |
|---|---|---|---|
| Previous Owner | Brown Amy D | $283,900 |
Source: Public Records
Tax History
| Year | Tax Paid | Tax Assessment Tax Assessment Total Assessment is a certain percentage of the fair market value that is determined by local assessors to be the total taxable value of land and additions on the property. | Land | Improvement |
|---|---|---|---|---|
| 2025 | $6,464 | $693,600 | $249,100 | $444,500 |
| 2024 | $6,365 | $689,600 | $249,100 | $440,500 |
| 2023 | $6,131 | $616,200 | $214,900 | $401,300 |
| 2022 | $5,818 | $569,300 | $195,700 | $373,600 |
| 2021 | $5,690 | $504,000 | $177,900 | $326,100 |
| 2020 | $5,574 | $504,000 | $177,900 | $326,100 |
| 2019 | $5,399 | $462,600 | $152,500 | $310,100 |
| 2018 | $5,155 | $438,700 | $145,100 | $293,600 |
| 2017 | $5,069 | $421,000 | $139,600 | $281,400 |
| 2016 | $4,663 | $382,800 | $136,900 | $245,900 |
| 2015 | $4,540 | $373,700 | $136,900 | $236,800 |
Source: Public Records
Map
Nearby Homes
Your Personal Tour Guide
Ask me questions while you tour the home.