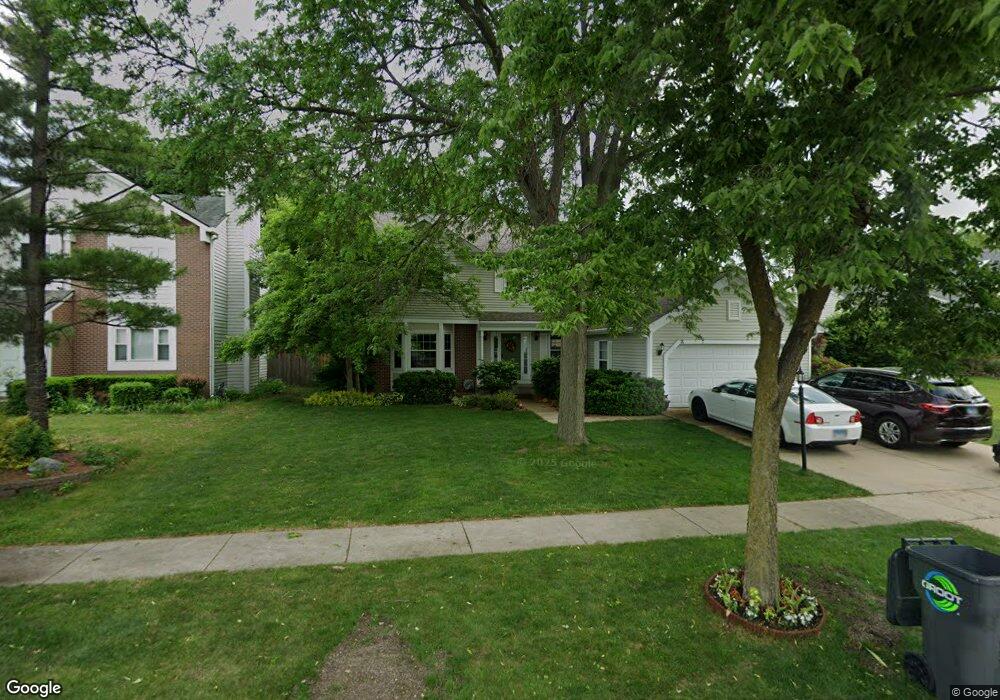
76 Magnolia Dr Streamwood, IL 60107
Estimated Value: $427,000 - $489,520
4
Beds
3
Baths
2,492
Sq Ft
$187/Sq Ft
Est. Value
About This Home
This home is located at 76 Magnolia Dr, Streamwood, IL 60107 and is currently estimated at $466,630, approximately $187 per square foot. 76 Magnolia Dr is a home located in Cook County with nearby schools including Hilltop Elementary School, Canton Middle School, and Streamwood High School.
Ownership History
Date
Name
Owned For
Owner Type
Purchase Details
Closed on
Jun 12, 2001
Sold by
Galioto John
Bought by
Young Richard A and Young Mary Alice P
Current Estimated Value
Home Financials for this Owner
Home Financials are based on the most recent Mortgage that was taken out on this home.
Original Mortgage
$190,000
Outstanding Balance
$70,311
Interest Rate
6.75%
Mortgage Type
Adjustable Rate Mortgage/ARM
Estimated Equity
$396,319
Purchase Details
Closed on
Feb 20, 2001
Sold by
Mannino Anthony
Bought by
Galioto John
Purchase Details
Closed on
Oct 17, 2000
Sold by
Gorzella Walter Joseph
Bought by
Mannino Anthony
Purchase Details
Closed on
Jun 18, 1999
Sold by
Yoder John C and Yoder Kathleen P
Bought by
Gorzela Walter Joseph and Mannino Anthony
Home Financials for this Owner
Home Financials are based on the most recent Mortgage that was taken out on this home.
Original Mortgage
$194,184
Interest Rate
7.55%
Create a Home Valuation Report for This Property
The Home Valuation Report is an in-depth analysis detailing your home's value as well as a comparison with similar homes in the area
Home Values in the Area
Average Home Value in this Area
Purchase History
| Date | Buyer | Sale Price | Title Company |
|---|---|---|---|
| Young Richard A | -- | -- | |
| Galioto John | $204,000 | -- | |
| Mannino Anthony | -- | -- | |
| Gorzela Walter Joseph | $216,000 | Professional National Title |
Source: Public Records
Mortgage History
| Date | Status | Borrower | Loan Amount |
|---|---|---|---|
| Open | Young Richard A | $190,000 | |
| Previous Owner | Gorzela Walter Joseph | $194,184 |
Source: Public Records
Tax History Compared to Growth
Tax History
| Year | Tax Paid | Tax Assessment Tax Assessment Total Assessment is a certain percentage of the fair market value that is determined by local assessors to be the total taxable value of land and additions on the property. | Land | Improvement |
|---|---|---|---|---|
| 2024 | $8,295 | $33,000 | $16,500 | $16,500 |
| 2023 | $8,033 | $33,000 | $16,500 | $16,500 |
| 2022 | $8,033 | $33,000 | $16,500 | $16,500 |
| 2021 | $9,076 | $28,217 | $17,056 | $11,161 |
| 2020 | $9,009 | $28,217 | $17,056 | $11,161 |
| 2019 | $8,890 | $31,353 | $17,056 | $14,297 |
| 2018 | $9,155 | $29,586 | $14,832 | $14,754 |
| 2017 | $9,059 | $29,586 | $14,832 | $14,754 |
| 2016 | $8,739 | $29,586 | $14,832 | $14,754 |
| 2015 | $8,899 | $27,789 | $13,348 | $14,441 |
| 2014 | $8,792 | $27,789 | $13,348 | $14,441 |
| 2013 | $8,482 | $27,789 | $13,348 | $14,441 |
Source: Public Records
Map
Nearby Homes
- 3 Taylor Ct Unit B
- 8 Taft Ct Unit A
- 617 Tanglewood Dr Unit 4
- 20 Coolidge Ct Unit B
- 117 Marryat Place
- 104 Cottonwood Dr Unit 2
- 422 Tanglewood Dr
- 418 Tanglewood Dr
- 1504 Laurel Oaks Dr
- 1420 Yellowstone Dr
- 406 Cahill Rd
- 105 Canton Ln
- 24 Fillmore Ln
- 40 Jackson Ln
- 1201 Oak Ridge Dr
- 1463 Yellowstone Dr
- 107 Janet Ave
- 36 Evergreen Dr
- 3 Dorchester Ct
- 167 Southwicke Dr Unit 3404D
- 74 W Magnolia Dr
- 78 Magnolia Dr
- 74 Magnolia Dr
- 72 Magnolia Dr
- 80 Magnolia Dr
- 77 Magnolia Dr
- 75 Magnolia Dr
- 79 Magnolia Dr
- 71 Magnolia Dr
- 107 Bittersweet Ln
- 70 Magnolia Dr
- 81 Magnolia Dr
- 9 Jonquil Ct
- 63 W Magnolia Dr
- 111 Bittersweet Ln
- 7 Jonquil Ct
- 63 Magnolia Dr
- 109 Bittersweet Ln
- 11 Jonquil Ct
- 5 Jonquil Ct