
Seller's Agent in 2026
Melisa Gagne
RE/MAX
(508) 264-6905
3 in this area
174 Total Sales
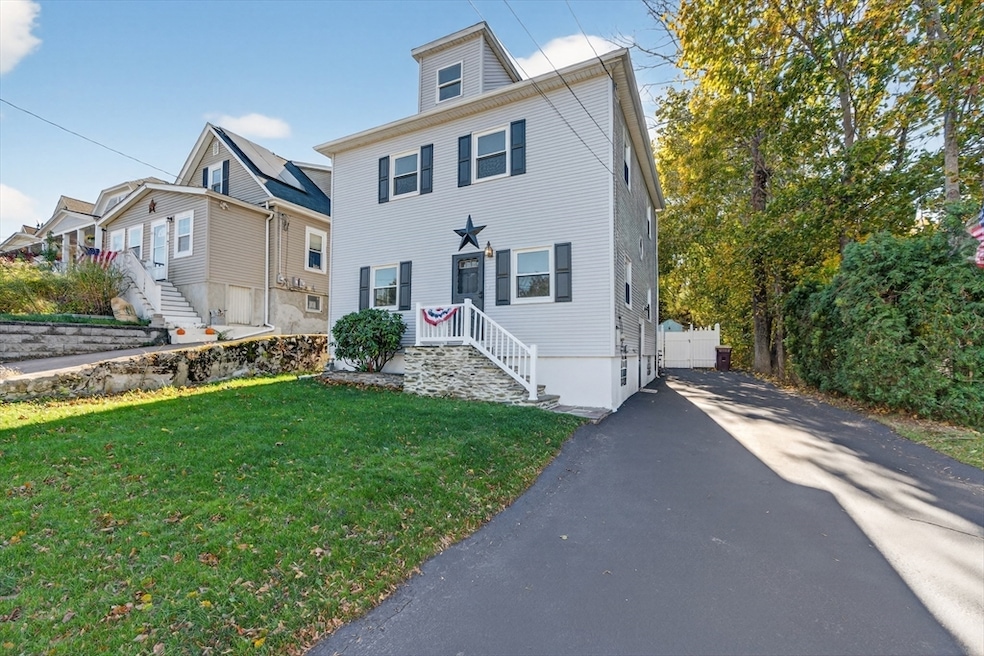
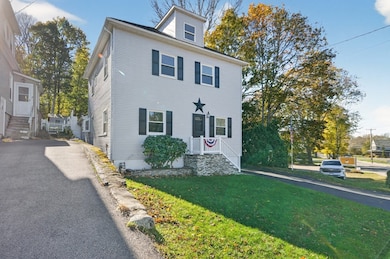
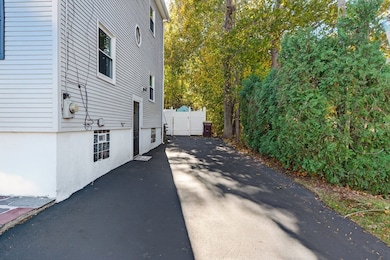
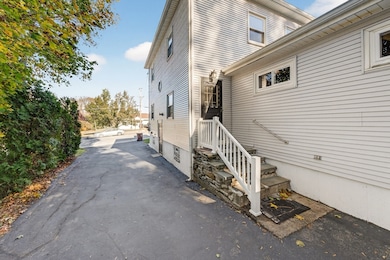
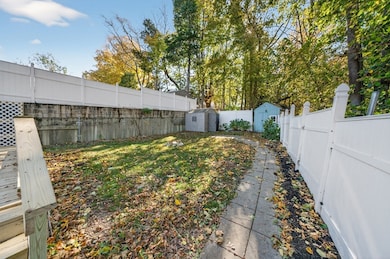
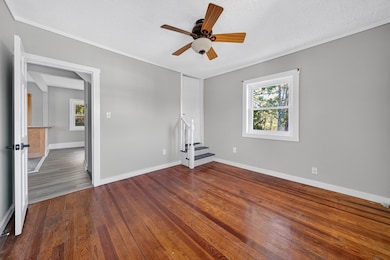
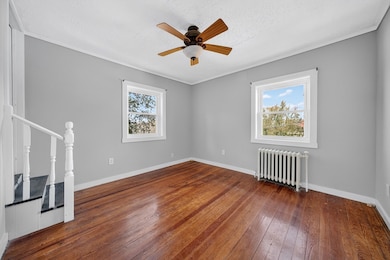
Beautifully updated 3-bedroom, 2-bath, 2 kitchen home in Acushnet! New vinyl siding, Freshly painted throughout, brand-new windows installed this month, this property is ready for its new owners to move right in. The flexible floor plan features two kitchens, offering great potential for an in-law setup, guest space, home office, extended living, etc. Enjoy a fully fenced yard with deck and off-street parking for at least three vehicles. Roof was replaced 10 years ago and there are beautiful hardwood floors as well as cast iron baseboard with gas heat and town water & sewer. Move-in ready and freshly updated throughout. 1st floor primary bedroom suite with Ensuite full bath with jacuzzi jet tub and shower. The location of this house offers easy access for your every day commute while also being nearby local shopping, restaurants, parks, Acushnet Creamery and more.
| Date | Type | Sale Price | Title Company |
|---|---|---|---|
| Quit Claim Deed | $480,000 | -- | |
| Quit Claim Deed | -- | None Available | |
| Quit Claim Deed | $425,000 | None Available | |
| Deed | -- | -- |
| Date | Status | Loan Amount | Loan Type |
|---|---|---|---|
| Open | $471,306 | FHA | |
| Previous Owner | $403,750 | Purchase Money Mortgage | |
| Previous Owner | $10,000 | No Value Available | |
| Previous Owner | $135,850 | No Value Available |
| Date | Event | Price | List to Sale | Price per Sq Ft |
|---|---|---|---|---|
| 01/28/2026 01/28/26 | Sold | $480,000 | +2.3% | $252 / Sq Ft |
| 12/22/2025 12/22/25 | Pending | -- | -- | -- |
| 12/11/2025 12/11/25 | Price Changed | $469,000 | -1.1% | $246 / Sq Ft |
| 12/08/2025 12/08/25 | Price Changed | $474,000 | -1.0% | $249 / Sq Ft |
| 12/02/2025 12/02/25 | Price Changed | $479,000 | -0.2% | $252 / Sq Ft |
| 11/18/2025 11/18/25 | Price Changed | $479,999 | -1.8% | $252 / Sq Ft |
| 11/10/2025 11/10/25 | For Sale | $489,000 | -- | $257 / Sq Ft |
| Year | Tax Paid | Tax Assessment Tax Assessment Total Assessment is a certain percentage of the fair market value that is determined by local assessors to be the total taxable value of land and additions on the property. | Land | Improvement |
|---|---|---|---|---|
| 2025 | $45 | $416,700 | $116,100 | $300,600 |
| 2024 | $4,179 | $366,300 | $110,000 | $256,300 |
| 2023 | $4,134 | $344,500 | $99,800 | $244,700 |
| 2022 | $3,852 | $290,300 | $93,700 | $196,600 |
| 2021 | $3,802 | $272,700 | $93,700 | $179,000 |
| 2020 | $12,170 | $266,600 | $87,600 | $179,000 |
| 2019 | $3,588 | $253,000 | $83,500 | $169,500 |
| 2018 | $3,539 | $240,200 | $83,500 | $156,700 |
| 2017 | $3,363 | $232,900 | $83,500 | $149,400 |
| 2016 | $3,154 | $217,100 | $83,500 | $133,600 |
| 2015 | $3,100 | $217,100 | $83,500 | $133,600 |
Seller's Agent in 2026
Melisa Gagne
RE/MAX
(508) 264-6905
3 in this area
174 Total Sales
M
Buyer's Agent in 2026
Mark Bourgeois
LPT Realty - Home & Key Group
(508) 264-7127
1 in this area
36 Total Sales
Source: MLS Property Information Network (MLS PIN)
MLS Number: 73453275
APN: ACUS-000025-000000-000021
Disclaimer: Certain information contained herein is derived from information provided by parties other than Homes.com. All information provided is deemed reliable, but is not guaranteed to be accurate and should be independently verified.
![]() The property listing data and information, or the Images, set forth herein were provided to MLS Property Information Network, Inc. from third party sources, including sellers, lessors and public records, and were compiled by MLS Property Information Network, Inc. The property listing data and information, and the Images, are for the personal, non-commercial use of consumers having a good faith interest in purchasing or leasing listed properties of the type displayed to them and may not be used for any purpose other than to identify prospective properties which such consumers may have a good faith interest in purchasing or leasing. MLS Property Information Network, Inc. and its subscribers disclaim any and all representations and warranties as to the accuracy of the property listing data and information, or as to the accuracy of any of the Images, set forth herein.
The property listing data and information, or the Images, set forth herein were provided to MLS Property Information Network, Inc. from third party sources, including sellers, lessors and public records, and were compiled by MLS Property Information Network, Inc. The property listing data and information, and the Images, are for the personal, non-commercial use of consumers having a good faith interest in purchasing or leasing listed properties of the type displayed to them and may not be used for any purpose other than to identify prospective properties which such consumers may have a good faith interest in purchasing or leasing. MLS Property Information Network, Inc. and its subscribers disclaim any and all representations and warranties as to the accuracy of the property listing data and information, or as to the accuracy of any of the Images, set forth herein.
Ask me questions while you tour the home.