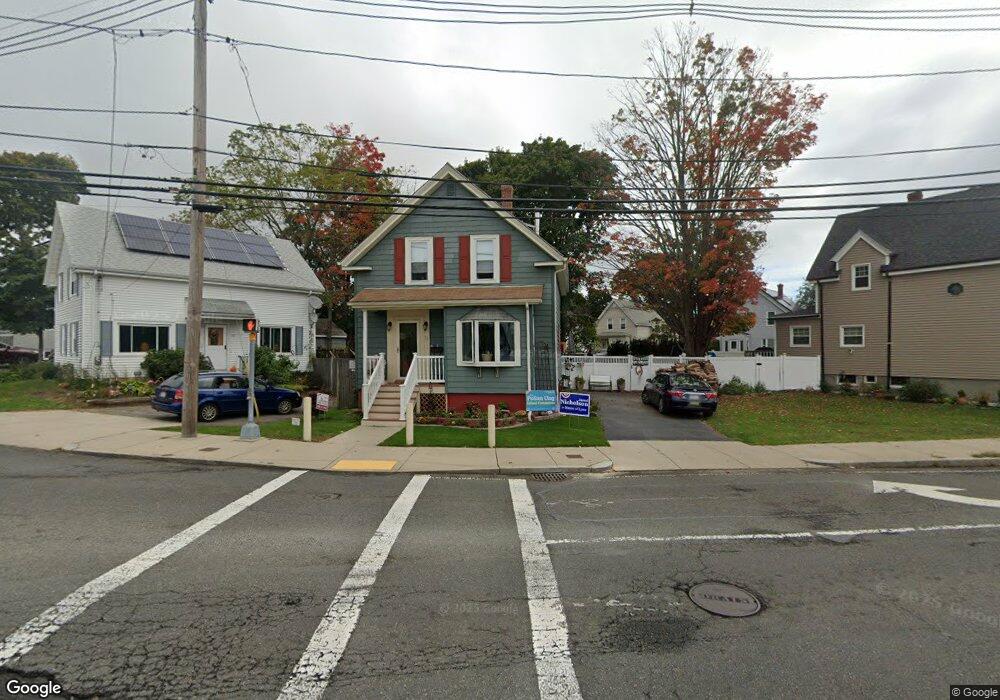
76 Maple St Lynn, MA 01904
Chatham Street NeighborhoodEstimated Value: $538,000 - $664,000
3
Beds
2
Baths
1,105
Sq Ft
$525/Sq Ft
Est. Value
About This Home
This home is located at 76 Maple St, Lynn, MA 01904 and is currently estimated at $579,707, approximately $524 per square foot. 76 Maple St is a home located in Essex County with nearby schools including Edward A. Sisson Elementary School, William R. Fallon School, and Pickering Middle School.
Ownership History
Date
Name
Owned For
Owner Type
Purchase Details
Closed on
Aug 27, 2004
Sold by
Colon Ann Marie and Colon Joseph
Bought by
Sawyer Diane G
Current Estimated Value
Home Financials for this Owner
Home Financials are based on the most recent Mortgage that was taken out on this home.
Original Mortgage
$257,400
Outstanding Balance
$128,712
Interest Rate
6.02%
Mortgage Type
Purchase Money Mortgage
Estimated Equity
$450,995
Purchase Details
Closed on
Oct 27, 1995
Sold by
Kane Michael W and Kane Mary M
Bought by
Daly Ann Marie
Create a Home Valuation Report for This Property
The Home Valuation Report is an in-depth analysis detailing your home's value as well as a comparison with similar homes in the area
Home Values in the Area
Average Home Value in this Area
Purchase History
| Date | Buyer | Sale Price | Title Company |
|---|---|---|---|
| Sawyer Diane G | $286,000 | -- | |
| Sawyer Diane G | $286,000 | -- | |
| Daly Ann Marie | $92,000 | -- | |
| Daly Ann Marie | $92,000 | -- |
Source: Public Records
Mortgage History
| Date | Status | Borrower | Loan Amount |
|---|---|---|---|
| Open | Daly Ann Marie | $257,400 | |
| Closed | Daly Ann Marie | $14,300 |
Source: Public Records
Tax History
| Year | Tax Paid | Tax Assessment Tax Assessment Total Assessment is a certain percentage of the fair market value that is determined by local assessors to be the total taxable value of land and additions on the property. | Land | Improvement |
|---|---|---|---|---|
| 2025 | $5,172 | $499,200 | $212,300 | $286,900 |
| 2024 | $5,039 | $478,500 | $207,500 | $271,000 |
| 2023 | $4,820 | $432,300 | $195,000 | $237,300 |
| 2022 | $4,621 | $371,800 | $160,000 | $211,800 |
| 2021 | $4,687 | $359,700 | $162,000 | $197,700 |
| 2020 | $4,397 | $328,100 | $146,000 | $182,100 |
| 2019 | $4,419 | $309,000 | $137,500 | $171,500 |
| 2018 | $4,113 | $271,500 | $128,000 | $143,500 |
| 2017 | $3,853 | $247,000 | $113,000 | $134,000 |
| 2016 | $3,739 | $231,100 | $104,500 | $126,600 |
| 2015 | $3,713 | $221,700 | $111,000 | $110,700 |
Source: Public Records
Map
Nearby Homes
- 31 Atkins Ave
- 12 W Colony Rd
- 431-433 Chatham St
- 6A Goodridge St
- 48 Clarendon Ave
- 10 Pond St
- 2 Chestnut Terrace
- 16 Ferris Rd
- 38 Ledgemont Ln
- 91 Oakwood Ave
- 16 Clinton St
- 11 Urban St
- 479 Broadway
- 73 Lockwood Rd
- 5 Rockingham St
- 100 Magnolia Ave Unit 5
- 11 Birch St
- 277 Euclid Ave
- 50 Webster St
- 12 Eade St
Your Personal Tour Guide
Ask me questions while you tour the home.