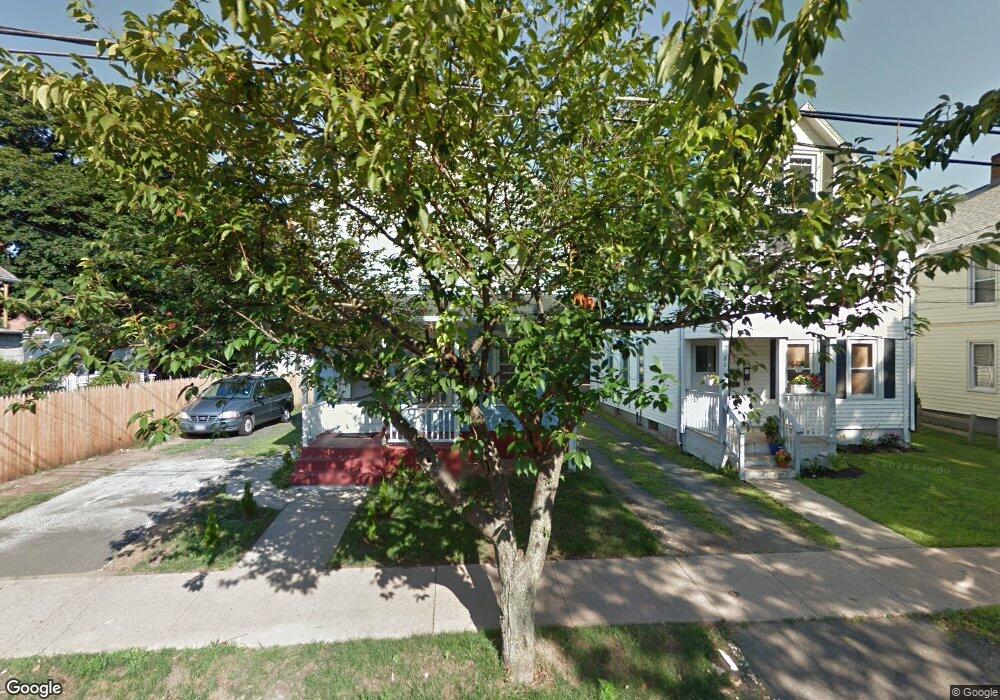
76 Meadow St Wallingford, CT 06492
Estimated Value: $298,000 - $405,000
3
Beds
1
Bath
1,467
Sq Ft
$234/Sq Ft
Est. Value
About This Home
This home is located at 76 Meadow St, Wallingford, CT 06492 and is currently estimated at $343,310, approximately $234 per square foot. 76 Meadow St is a home located in New Haven County with nearby schools including Moses Y Beach Elementary School, Rock Hill Elementary School, and Dag Hammarskjold Middle School.
Ownership History
Date
Name
Owned For
Owner Type
Purchase Details
Closed on
Jun 30, 2010
Sold by
Department Of Housing & Urban Dev
Bought by
Reyes Javier and Reyes Carolina
Current Estimated Value
Home Financials for this Owner
Home Financials are based on the most recent Mortgage that was taken out on this home.
Original Mortgage
$104,000
Outstanding Balance
$69,660
Interest Rate
4.88%
Estimated Equity
$273,650
Purchase Details
Closed on
Apr 7, 2010
Sold by
Gmac Mortgage Llc
Bought by
Department Of Housing & Urban Dev
Purchase Details
Closed on
Mar 5, 2010
Sold by
Anderson Robin K
Bought by
Gmac Mortgage Llc
Purchase Details
Closed on
Oct 12, 2004
Sold by
Russo Theresa
Bought by
Anderson Robin K
Purchase Details
Closed on
Jun 8, 1993
Sold by
Costa Randall D and Costa Lisa I
Bought by
Russo Frank N and Russo Theresa
Create a Home Valuation Report for This Property
The Home Valuation Report is an in-depth analysis detailing your home's value as well as a comparison with similar homes in the area
Home Values in the Area
Average Home Value in this Area
Purchase History
| Date | Buyer | Sale Price | Title Company |
|---|---|---|---|
| Reyes Javier | $130,000 | -- | |
| Reyes Javier | $130,000 | -- | |
| Department Of Housing & Urban Dev | -- | -- | |
| Department Of Housing & Urban Dev | -- | -- | |
| Gmac Mortgage Llc | -- | -- | |
| Gmac Mortgage Llc | -- | -- | |
| Anderson Robin K | $169,900 | -- | |
| Anderson Robin K | $169,900 | -- | |
| Russo Frank N | $112,000 | -- | |
| Russo Frank N | $112,000 | -- |
Source: Public Records
Mortgage History
| Date | Status | Borrower | Loan Amount |
|---|---|---|---|
| Open | Russo Frank N | $104,000 | |
| Closed | Russo Frank N | $104,000 |
Source: Public Records
Tax History
| Year | Tax Paid | Tax Assessment Tax Assessment Total Assessment is a certain percentage of the fair market value that is determined by local assessors to be the total taxable value of land and additions on the property. | Land | Improvement |
|---|---|---|---|---|
| 2025 | $4,544 | $188,400 | $71,600 | $116,800 |
| 2024 | $3,918 | $127,800 | $59,700 | $68,100 |
| 2023 | $3,750 | $127,800 | $59,700 | $68,100 |
| 2022 | $3,711 | $127,800 | $59,700 | $68,100 |
| 2021 | $3,645 | $127,800 | $59,700 | $68,100 |
| 2020 | $3,763 | $128,900 | $63,900 | $65,000 |
| 2019 | $3,763 | $128,900 | $63,900 | $65,000 |
| 2018 | $3,692 | $128,900 | $63,900 | $65,000 |
| 2017 | $3,680 | $128,900 | $63,900 | $65,000 |
| 2016 | $3,595 | $128,900 | $63,900 | $65,000 |
| 2015 | $3,362 | $122,400 | $63,900 | $58,500 |
| 2014 | $3,291 | $122,400 | $63,900 | $58,500 |
Source: Public Records
Map
Nearby Homes
- 85 N Colony St
- 42 S Cherry St Unit 238
- 120 S Cherry St
- 90 Masonic Ave
- 30 Clinton Place
- 570 N Main St
- 71 Cedar Ln
- 31 S Turnpike Rd Unit C2
- 46 Walnut Ln
- 70 N Turnpike Rd Unit 21
- 61 Cheshire Rd
- 1 Dean Dr
- 5 Kish Place
- 69 Terrace Gardens
- 30 King St
- 70 Putter Dr Unit 211
- 57 Terrace Gardens Unit 57
- 21 Putter Dr Unit 303S
- 16 Putter Dr Unit 207S
- 230 Main St Unit 18
Your Personal Tour Guide
Ask me questions while you tour the home.