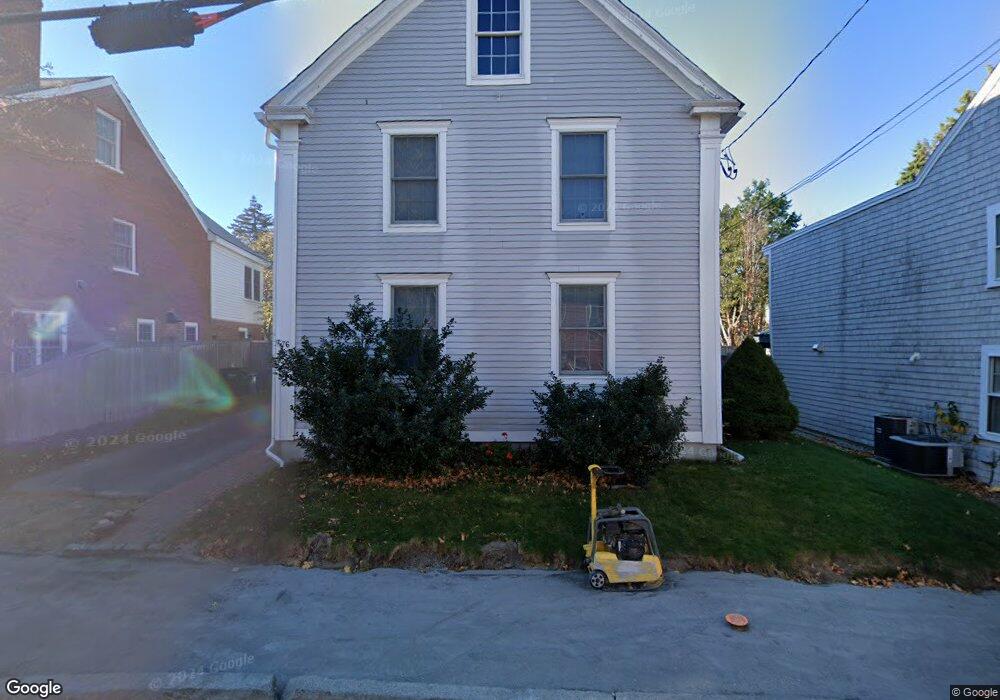
76 Middle St Newburyport, MA 01950
Estimated Value: $1,270,754 - $1,405,000
3
Beds
2
Baths
2,027
Sq Ft
$655/Sq Ft
Est. Value
About This Home
This home is located at 76 Middle St, Newburyport, MA 01950 and is currently estimated at $1,328,689, approximately $655 per square foot. 76 Middle St is a home located in Essex County with nearby schools including Francis T. Bresnahan Elementary School, Edward G. Molin Elementary School, and Rupert A. Nock Middle School.
Ownership History
Date
Name
Owned For
Owner Type
Purchase Details
Closed on
May 26, 2022
Sold by
Wick Mark J
Bought by
M Wick T 2022
Current Estimated Value
Purchase Details
Closed on
Sep 3, 2004
Sold by
Levy Michael A and Mastandrea Linda
Bought by
Wick Mark J
Purchase Details
Closed on
Jan 15, 1997
Sold by
Soucie Robert F and Soucie Fern K
Bought by
Levy Michael A and Mastandrea Linda
Create a Home Valuation Report for This Property
The Home Valuation Report is an in-depth analysis detailing your home's value as well as a comparison with similar homes in the area
Home Values in the Area
Average Home Value in this Area
Purchase History
| Date | Buyer | Sale Price | Title Company |
|---|---|---|---|
| M Wick T 2022 | -- | None Available | |
| Wick Mark J | $544,000 | -- | |
| Levy Michael A | $150,000 | -- |
Source: Public Records
Mortgage History
| Date | Status | Borrower | Loan Amount |
|---|---|---|---|
| Previous Owner | Levy Michael A | $398,000 | |
| Previous Owner | Levy Michael A | $43,000 |
Source: Public Records
Tax History Compared to Growth
Tax History
| Year | Tax Paid | Tax Assessment Tax Assessment Total Assessment is a certain percentage of the fair market value that is determined by local assessors to be the total taxable value of land and additions on the property. | Land | Improvement |
|---|---|---|---|---|
| 2025 | $9,702 | $1,012,700 | $423,000 | $589,700 |
| 2024 | $9,448 | $947,600 | $384,500 | $563,100 |
| 2023 | $8,782 | $817,700 | $334,300 | $483,400 |
| 2022 | $8,215 | $684,000 | $278,600 | $405,400 |
| 2021 | $8,148 | $644,600 | $253,300 | $391,300 |
| 2020 | $8,413 | $655,200 | $253,300 | $401,900 |
| 2019 | $8,111 | $620,100 | $253,300 | $366,800 |
| 2018 | $7,720 | $582,200 | $241,200 | $341,000 |
| 2017 | $7,676 | $570,700 | $229,700 | $341,000 |
| 2016 | $7,591 | $566,900 | $209,300 | $357,600 |
| 2015 | $7,253 | $543,700 | $209,300 | $334,400 |
Source: Public Records
Map
Nearby Homes
- 42 Federal St Unit B
- 11 Charter St
- 58 Lime St Unit 5
- 57 Lime St Unit 1
- 30-32 Water St Unit 4
- 10 10th St
- 105 State St Unit 301
- 105 State St Unit 101
- 105 State St Unit 201
- 95 High St Unit 4
- 95 High St Unit 1
- 166 Water St Unit B
- 164 Water St Unit A
- 58 Merrimac St Unit 2-5
- 2 Court St Unit 4
- 1 Hill St
- 1 Hill St Unit 1
- 17 Madison St
- 41 Washington St Unit B
- 126 Merrimac St Unit 47