Estimated Value: $178,865 - $287,000
2
Beds
1
Bath
704
Sq Ft
$318/Sq Ft
Est. Value
About This Home
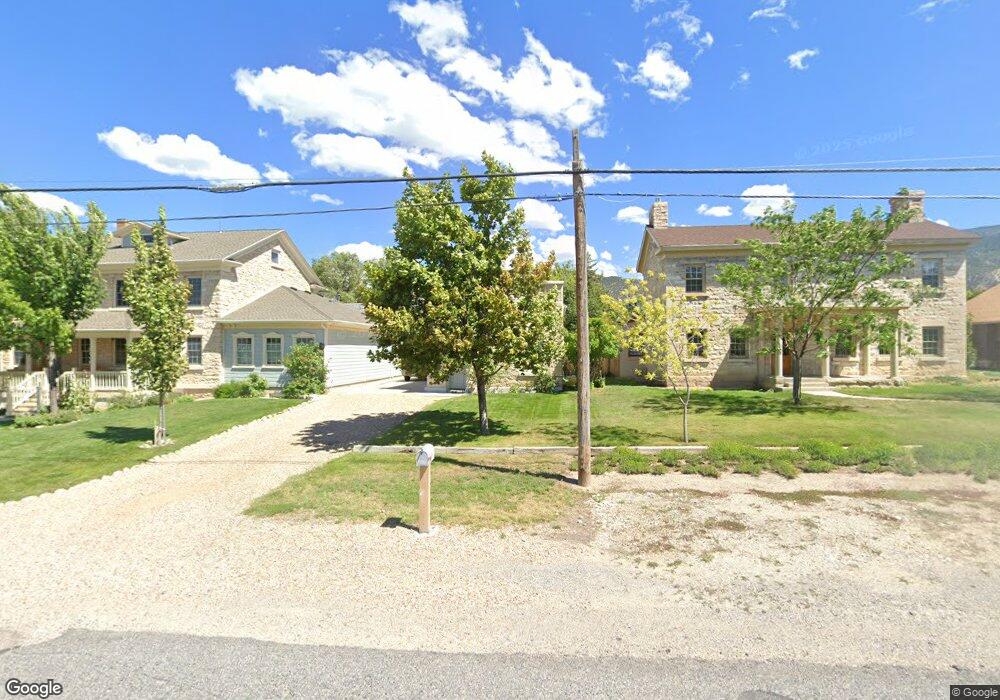
This home is located at 76 N 100 W, Manti, UT 84642 and is currently estimated at $223,966, approximately $318 per square foot. 76 N 100 W is a home located in Sanpete County.
Ownership History
Date
Name
Owned For
Owner Type
Purchase Details
Closed on
Nov 16, 2018
Sold by
Erwin Nepomuceno and Erwin Lucy Z
Bought by
Erickson Gary
Current Estimated Value
Home Financials for this Owner
Home Financials are based on the most recent Mortgage that was taken out on this home.
Original Mortgage
$82,000
Outstanding Balance
$71,955
Interest Rate
4.7%
Mortgage Type
New Conventional
Estimated Equity
$152,011
Purchase Details
Closed on
Nov 24, 2014
Sold by
Janet Janet and The Estate Of Virginia F Bunne
Bought by
Nepomuceno Erwin and Nepomuceno Lucy Z
Purchase Details
Closed on
Jul 12, 2012
Sold by
Bunnell Virginia F
Bought by
Bunnell Virginia F
Purchase Details
Closed on
Jun 12, 2012
Sold by
Bunnell Virginia F
Bought by
Bunnell Virginia F
Create a Home Valuation Report for This Property
The Home Valuation Report is an in-depth analysis detailing your home's value as well as a comparison with similar homes in the area
Home Values in the Area
Average Home Value in this Area
Purchase History
| Date | Buyer | Sale Price | Title Company |
|---|---|---|---|
| Erickson Gary | -- | -- | |
| Nepomuceno Erwin | -- | Central Utah Title | |
| Bunnell Virginia F | -- | -- | |
| Bunnell Virginia F | -- | -- |
Source: Public Records
Mortgage History
| Date | Status | Borrower | Loan Amount |
|---|---|---|---|
| Open | Erickson Gary | $82,000 | |
| Closed | Erickson Gary | $82,000 |
Source: Public Records
Tax History Compared to Growth
Tax History
| Year | Tax Paid | Tax Assessment Tax Assessment Total Assessment is a certain percentage of the fair market value that is determined by local assessors to be the total taxable value of land and additions on the property. | Land | Improvement |
|---|---|---|---|---|
| 2024 | $656 | $63,021 | $0 | $0 |
| 2023 | $653 | $59,176 | $0 | $0 |
| 2022 | $851 | $70,372 | $0 | $0 |
| 2021 | $816 | $58,361 | $0 | $0 |
| 2020 | $765 | $51,495 | $0 | $0 |
| 2019 | $715 | $47,245 | $0 | $0 |
| 2018 | $643 | $74,697 | $23,463 | $51,234 |
| 2017 | $576 | $38,757 | $0 | $0 |
| 2016 | $540 | $36,353 | $0 | $0 |
| 2015 | $543 | $36,353 | $0 | $0 |
| 2014 | $532 | $36,353 | $0 | $0 |
| 2013 | -- | $36,038 | $0 | $0 |
Source: Public Records
Map
Nearby Homes