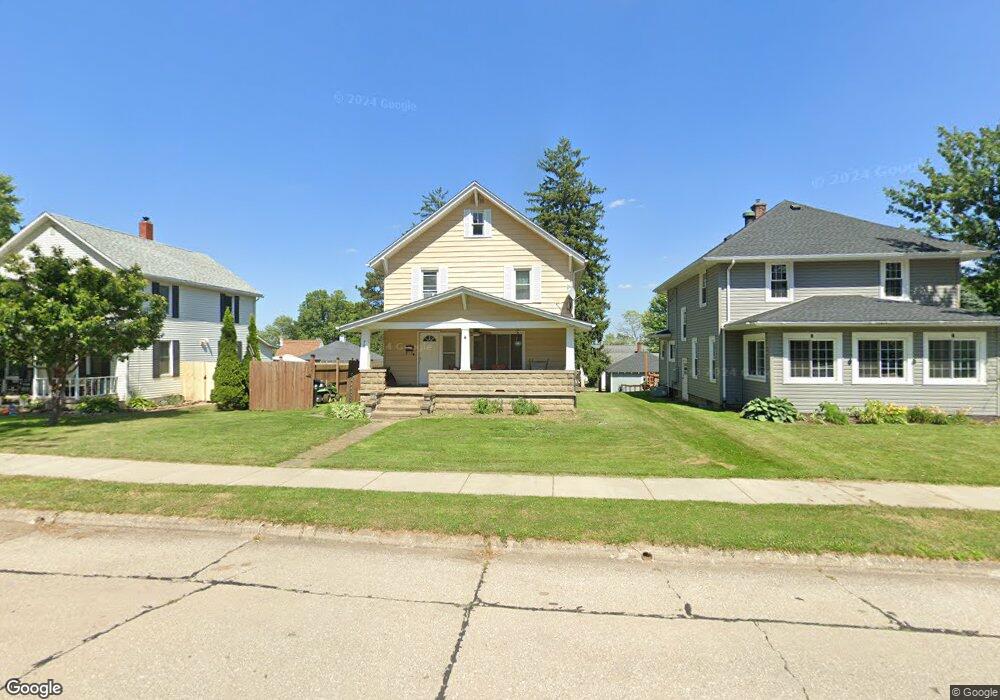
76 N 3rd St Rittman, OH 44270
Estimated Value: $173,369 - $223,000
3
Beds
2
Baths
1,352
Sq Ft
$144/Sq Ft
Est. Value
About This Home
This home is located at 76 N 3rd St, Rittman, OH 44270 and is currently estimated at $195,092, approximately $144 per square foot. 76 N 3rd St is a home located in Wayne County with nearby schools including Rittman Elementary School, Rittman Middle School, and Rittman High School.
Ownership History
Date
Name
Owned For
Owner Type
Purchase Details
Closed on
Dec 11, 2001
Sold by
Labo Delbert T
Bought by
Vance Shawn W
Current Estimated Value
Home Financials for this Owner
Home Financials are based on the most recent Mortgage that was taken out on this home.
Original Mortgage
$87,200
Outstanding Balance
$34,352
Interest Rate
6.68%
Mortgage Type
New Conventional
Estimated Equity
$160,740
Purchase Details
Closed on
Nov 20, 1996
Sold by
Reckner Carl E
Bought by
Labo Delbert T and Labo Julie K
Home Financials for this Owner
Home Financials are based on the most recent Mortgage that was taken out on this home.
Original Mortgage
$63,700
Interest Rate
7.94%
Mortgage Type
New Conventional
Create a Home Valuation Report for This Property
The Home Valuation Report is an in-depth analysis detailing your home's value as well as a comparison with similar homes in the area
Home Values in the Area
Average Home Value in this Area
Purchase History
| Date | Buyer | Sale Price | Title Company |
|---|---|---|---|
| Vance Shawn W | $89,900 | -- | |
| Labo Delbert T | $75,000 | -- |
Source: Public Records
Mortgage History
| Date | Status | Borrower | Loan Amount |
|---|---|---|---|
| Open | Vance Shawn W | $87,200 | |
| Previous Owner | Labo Delbert T | $63,700 |
Source: Public Records
Tax History
| Year | Tax Paid | Tax Assessment Tax Assessment Total Assessment is a certain percentage of the fair market value that is determined by local assessors to be the total taxable value of land and additions on the property. | Land | Improvement |
|---|---|---|---|---|
| 2024 | $1,605 | $39,160 | $9,790 | $29,370 |
| 2023 | $1,612 | $39,160 | $9,790 | $29,370 |
| 2022 | $1,399 | $30,350 | $7,590 | $22,760 |
| 2021 | $1,423 | $30,350 | $7,590 | $22,760 |
| 2020 | $1,519 | $30,350 | $7,590 | $22,760 |
| 2019 | $1,541 | $29,400 | $7,430 | $21,970 |
| 2018 | $1,553 | $29,400 | $7,430 | $21,970 |
| 2017 | $1,478 | $29,400 | $7,430 | $21,970 |
| 2016 | $1,459 | $28,270 | $7,140 | $21,130 |
| 2015 | $1,437 | $28,270 | $7,140 | $21,130 |
| 2014 | $1,433 | $28,270 | $7,140 | $21,130 |
| 2013 | $1,503 | $29,800 | $9,430 | $20,370 |
Source: Public Records
Map
Nearby Homes
- 96 W Ohio Ave
- 64 Sheldon St
- 27 S State St
- 109 W Sunset Dr
- 136 S Metzger Ave
- 30 Medina St
- 54 Salt St
- 56 Salt St
- 112 Greenwood Ave
- 132 E Sunset Dr
- 245 Industrial St
- 355 N Main St
- 327 Briarhill St
- 356 Cardinal Dr
- 318 Winkler Dr
- 22, 23 Gish Rd
- 53 Thonen St
- 0 E Ohio Ave Unit 5118655
- 428 Overlook Dr
- 230 Clifton Ln
Your Personal Tour Guide
Ask me questions while you tour the home.