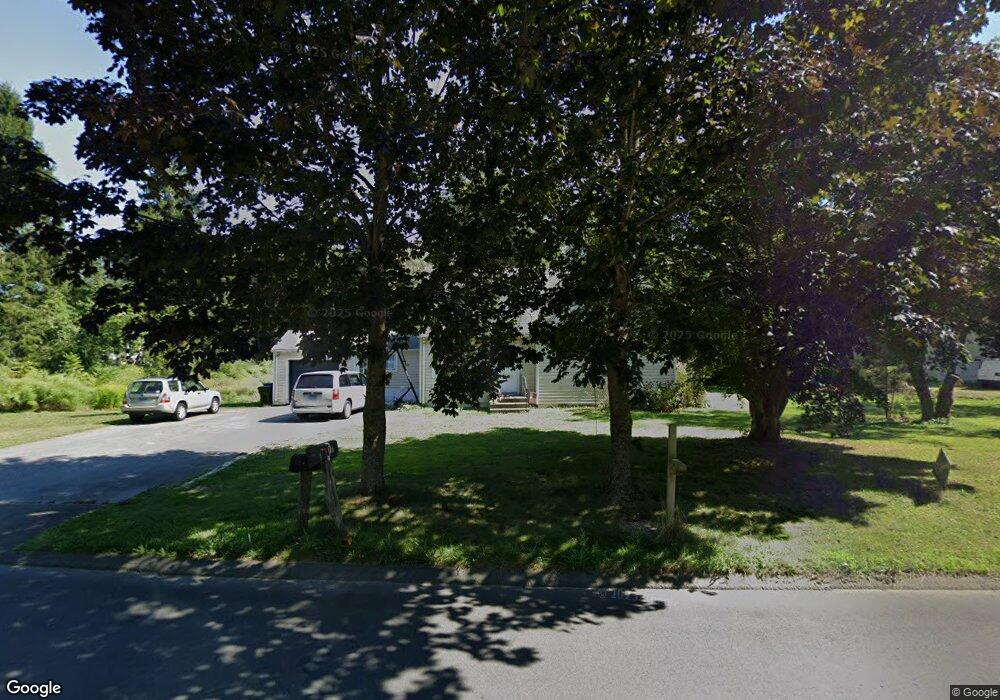
76 N High St Clinton, CT 06413
Clinton AreaEstimated Value: $314,000 - $457,000
2
Beds
1
Bath
1,401
Sq Ft
$273/Sq Ft
Est. Value
About This Home
This home is located at 76 N High St, Clinton, CT 06413 and is currently estimated at $382,469, approximately $272 per square foot. 76 N High St is a home located in Middlesex County with nearby schools including Lewin G. Joel Jr. School, The Morgan School, and Our Lady of Mercy Preparatory Academy.
Create a Home Valuation Report for This Property
The Home Valuation Report is an in-depth analysis detailing your home's value as well as a comparison with similar homes in the area
Home Values in the Area
Average Home Value in this Area
Tax History
We collect this data history from publicly available records. To have your information removed, we recommend requesting removal directly through your county’s website.
| Year | Tax Paid | Tax Assessment Tax Assessment Total Assessment is a certain percentage of the fair market value that is determined by local assessors to be the total taxable value of land and additions on the property. | Land | Improvement |
|---|---|---|---|---|
| 2025 | $4,160 | $133,600 | $51,800 | $81,800 |
| 2024 | $4,043 | $133,600 | $51,800 | $81,800 |
| 2023 | $3,985 | $133,600 | $51,800 | $81,800 |
| 2022 | $3,985 | $133,600 | $51,800 | $81,800 |
| 2021 | $4,006 | $134,300 | $51,800 | $82,500 |
| 2020 | $4,197 | $134,300 | $51,800 | $82,500 |
| 2019 | $4,197 | $134,300 | $51,800 | $82,500 |
| 2018 | $4,102 | $134,300 | $51,800 | $82,500 |
| 2017 | $4,017 | $134,300 | $51,800 | $82,500 |
| 2016 | $3,645 | $134,300 | $51,800 | $82,500 |
| 2015 | $4,016 | $150,000 | $60,000 | $90,000 |
| 2014 | $3,941 | $150,000 | $60,000 | $90,000 |
Source: Public Records
Map
Nearby Homes
- 77 N High St
- 15 Silverbrook Ln
- 43-45 High St
- 9 Sandy Brook Rd Unit 2
- 145 Liberty St
- 64 W Main St
- 0 Cow Hill Rd
- 41 Sunnybrook Ln
- 73 Cow Hill Rd
- 18 Happy Acres Rd
- 57 Grove St
- 10 Oak Hill Dr
- 10 Highland Dr
- 6 Cedar Island Ave
- 20 Morgan Park
- 22 Morgan Park
- 110 E Main St
- 0 Fairy Dell Rd
- 89 Commerce St
- 26 Ninety Rod Rd
Your Personal Tour Guide
Ask me questions while you tour the home.