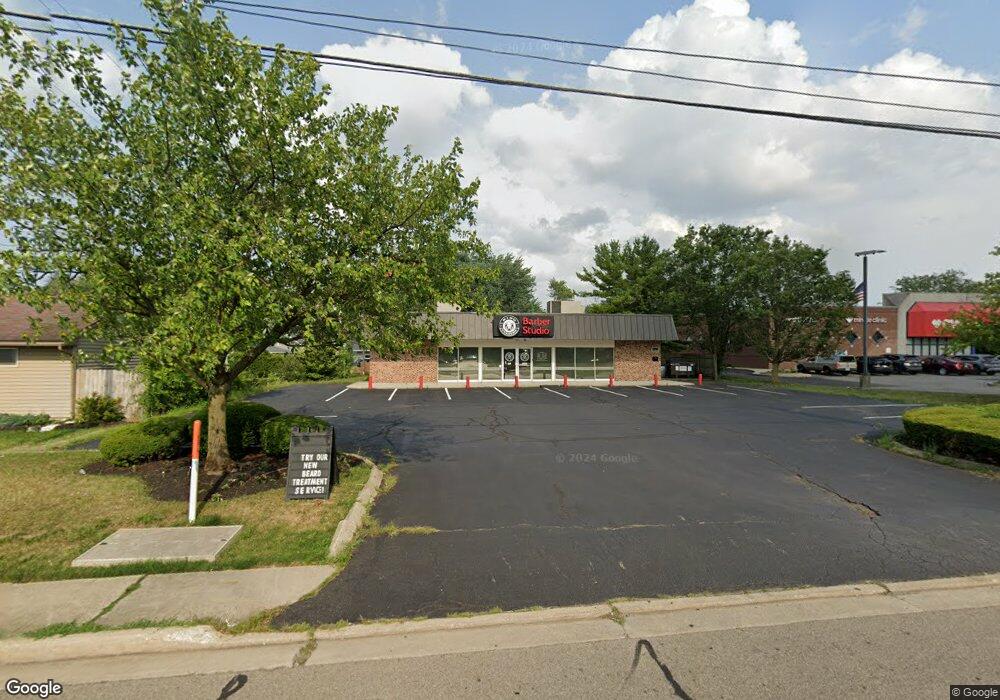
76 N Stygler Rd Gahanna, OH 43230
Estimated Value: $573,470
--
Bed
1
Bath
2,400
Sq Ft
$239/Sq Ft
Est. Value
About This Home
This home is located at 76 N Stygler Rd, Gahanna, OH 43230 and is currently estimated at $573,470, approximately $238 per square foot. 76 N Stygler Rd is a home located in Franklin County with nearby schools including Chapelfield Elementary School, Gahanna West Middle School, and Lincoln High School.
Ownership History
Date
Name
Owned For
Owner Type
Purchase Details
Closed on
Jan 28, 2019
Sold by
Krigbaum Properties Llc
Bought by
King Culture Real Estate Holdings Llc
Current Estimated Value
Home Financials for this Owner
Home Financials are based on the most recent Mortgage that was taken out on this home.
Original Mortgage
$337,000
Outstanding Balance
$296,881
Interest Rate
4.6%
Mortgage Type
Commercial
Estimated Equity
$276,589
Purchase Details
Closed on
Apr 12, 2006
Sold by
Stanley Real Estate Llc
Bought by
Krigbaum Properties Llc
Purchase Details
Closed on
Dec 13, 2000
Sold by
United Dairy Farmers Inc
Bought by
Stanley Properties Llc
Home Financials for this Owner
Home Financials are based on the most recent Mortgage that was taken out on this home.
Original Mortgage
$228,383
Interest Rate
7.83%
Mortgage Type
Commercial
Purchase Details
Closed on
Nov 27, 1985
Bought by
United Dairy Farmers Inc
Create a Home Valuation Report for This Property
The Home Valuation Report is an in-depth analysis detailing your home's value as well as a comparison with similar homes in the area
Home Values in the Area
Average Home Value in this Area
Purchase History
| Date | Buyer | Sale Price | Title Company |
|---|---|---|---|
| King Culture Real Estate Holdings Llc | $350,000 | Valmer Land Title Agency | |
| Krigbaum Properties Llc | $285,000 | Title First Agency | |
| Stanley Properties Llc | $240,000 | Title First Agency Inc | |
| United Dairy Farmers Inc | $216,300 | -- |
Source: Public Records
Mortgage History
| Date | Status | Borrower | Loan Amount |
|---|---|---|---|
| Open | King Culture Real Estate Holdings Llc | $337,000 | |
| Previous Owner | Stanley Properties Llc | $228,383 |
Source: Public Records
Tax History Compared to Growth
Tax History
| Year | Tax Paid | Tax Assessment Tax Assessment Total Assessment is a certain percentage of the fair market value that is determined by local assessors to be the total taxable value of land and additions on the property. | Land | Improvement |
|---|---|---|---|---|
| 2024 | $9,466 | $112,920 | $42,880 | $70,040 |
| 2023 | $9,366 | $112,910 | $42,875 | $70,035 |
| 2022 | $12,211 | $126,360 | $56,320 | $70,040 |
| 2021 | $11,987 | $126,360 | $56,320 | $70,040 |
| 2020 | $11,849 | $126,360 | $56,320 | $70,040 |
| 2019 | $10,144 | $112,000 | $53,620 | $58,380 |
| 2018 | $10,337 | $112,000 | $53,620 | $58,380 |
| 2017 | $9,656 | $112,000 | $53,620 | $58,380 |
| 2016 | $9,844 | $110,740 | $53,620 | $57,120 |
| 2015 | $9,906 | $110,740 | $53,620 | $57,120 |
| 2014 | $9,931 | $110,740 | $53,620 | $57,120 |
| 2013 | $3,521 | $80,150 | $42,630 | $37,520 |
Source: Public Records
Map
Nearby Homes
- 491 Daventry Ln
- 600 Agler Rd
- 348 Imperial Dr
- 300 Dunbarton Rd
- 300 Brookhaven Dr E
- 221 Lincolnshire Rd
- 388 Elkwood Place
- 407 Denison Ave
- 3888 Agler Rd
- 206 Lintner St
- 135 Serran Dr
- 0 E Minnesota Ave Unit 224018641
- 3832 Emmons Ave
- 183 Serran Dr
- 0 E Emmons Ave
- 3784 Armuth Ave
- 4125 Emerius Dr
- 148 Sierra Dr
- 2694 Kantian Dr
- 642 Ridenour Rd
- 335 Amfield Ct
- 327 Amfield Ct
- 104 N Stygler Rd
- 319 Amfield Ct
- 336 Amfield Ct
- 103 Moorfield Dr
- 311 Amfield Ct
- 314 Agler Rd
- 0 Amfield Ct
- 310 Amfield Ct
- 111 Moorfield Dr
- 305 Amfield Ct
- 333 Agler Rd
- 122 N Stygler Rd
- 125 N Stygler Rd
- 129 N Stygler Rd
- 104 Moorfield Dr
- 117 Moorfield Dr
- 297 Amfield Ct
- 77 N Stygler Rd