Estimated Value: $1,257,362 - $1,577,000
4
Beds
2
Baths
1,945
Sq Ft
$697/Sq Ft
Est. Value
About This Home
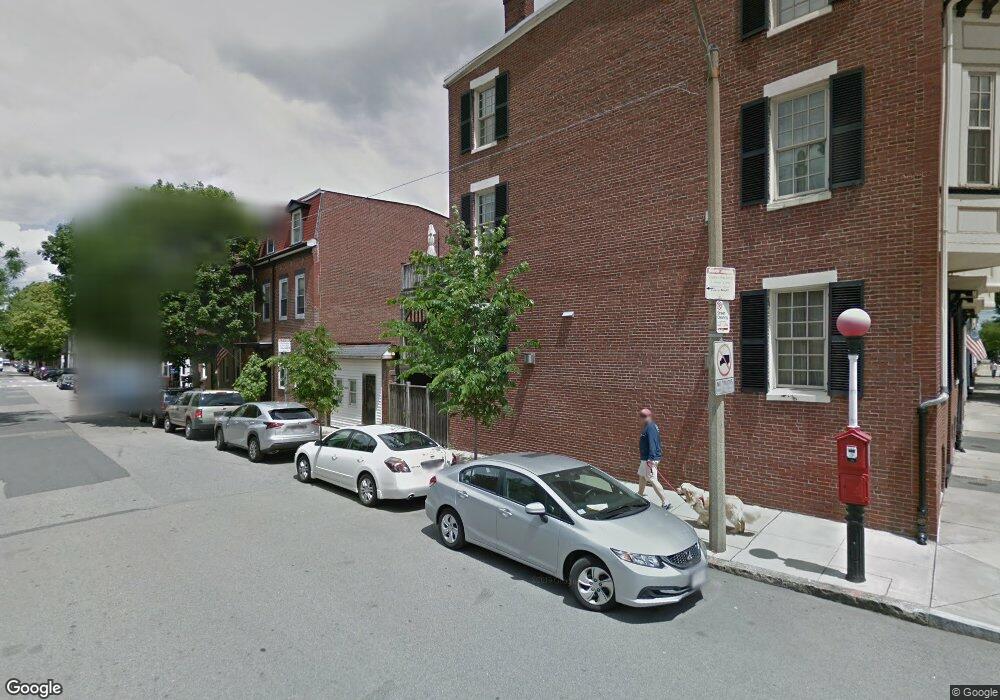
This home is located at 76 O St, South Boston, MA 02127 and is currently estimated at $1,356,091, approximately $697 per square foot. 76 O St is a home located in Suffolk County with nearby schools including South Boston Catholic Academy, Gate of Heaven Elementary School, and St Peter Academy.
Ownership History
Date
Name
Owned For
Owner Type
Purchase Details
Closed on
Oct 26, 2000
Sold by
Pozerski John F and Pozerski Joan M
Bought by
Knight John P and Knight Lisa Cummings
Current Estimated Value
Purchase Details
Closed on
Nov 15, 1995
Sold by
Morrissey Patrick F and Morrissey Deborah J
Bought by
Pozerski John F and Pozerski Joan M
Create a Home Valuation Report for This Property
The Home Valuation Report is an in-depth analysis detailing your home's value as well as a comparison with similar homes in the area
Home Values in the Area
Average Home Value in this Area
Purchase History
| Date | Buyer | Sale Price | Title Company |
|---|---|---|---|
| Knight John P | $417,000 | -- | |
| Pozerski John F | $191,000 | -- |
Source: Public Records
Mortgage History
| Date | Status | Borrower | Loan Amount |
|---|---|---|---|
| Open | Pozerski John F | $303,000 | |
| Closed | Pozerski John F | $303,000 | |
| Closed | Pozerski John F | $303,000 |
Source: Public Records
Tax History Compared to Growth
Tax History
| Year | Tax Paid | Tax Assessment Tax Assessment Total Assessment is a certain percentage of the fair market value that is determined by local assessors to be the total taxable value of land and additions on the property. | Land | Improvement |
|---|---|---|---|---|
| 2025 | $17,054 | $1,472,700 | $487,000 | $985,700 |
| 2024 | $14,330 | $1,314,700 | $324,600 | $990,100 |
| 2023 | $13,075 | $1,217,400 | $300,600 | $916,800 |
| 2022 | $12,261 | $1,126,900 | $278,300 | $848,600 |
| 2021 | $11,788 | $1,104,800 | $272,800 | $832,000 |
| 2020 | $9,696 | $918,200 | $298,300 | $619,900 |
| 2019 | $8,818 | $836,600 | $208,000 | $628,600 |
| 2018 | $8,187 | $781,200 | $208,000 | $573,200 |
| 2017 | $7,521 | $710,200 | $208,000 | $502,200 |
| 2016 | $6,854 | $623,100 | $208,000 | $415,100 |
| 2015 | $6,598 | $544,800 | $149,200 | $395,600 |
| 2014 | $6,467 | $514,100 | $149,200 | $364,900 |
Source: Public Records
Map
Nearby Homes
- 765 E 3rd St Unit 201
- 901 E Broadway Unit 1
- 52 O St Unit 3
- 733 E 3rd St
- 933 E Broadway
- 907 E 4th St Unit 2
- 838 E Broadway Unit 7
- 838 E Broadway Unit 3
- 945 E Broadway Unit 7
- 7 Kemble Place
- 915 E 4th St
- 803 E 5th St Unit 1
- 722 E 5th St Unit TH
- 788 E 4th St Unit 3
- 786 E 6th St Unit 788
- 37 Farragut Rd Unit 7
- 37 Farragut Rd Unit 6
- 37 Farragut Rd Unit Four
- 37 Farragut Rd Unit 3
- 37 Farragut Rd Unit 5
- 74 O St
- 74-76 O St
- 76 O St Unit 2
- 74 O St Unit 1
- 74 O St Unit 2
- 72 O St
- 70 O St
- 70 O St Unit 3
- 70 O St Unit 2
- 70 O St Unit 1
- 878 E Broadway
- 878 E Broadway Unit 3
- 872 E Broadway Unit 1
- 876 E Broadway Unit 2
- 876 E Broadway Unit 1
- 68 O St
- 68 O St Unit 2
- 68 O St Unit 1
- 874 E Broadway
- 874 E Broadway Unit A