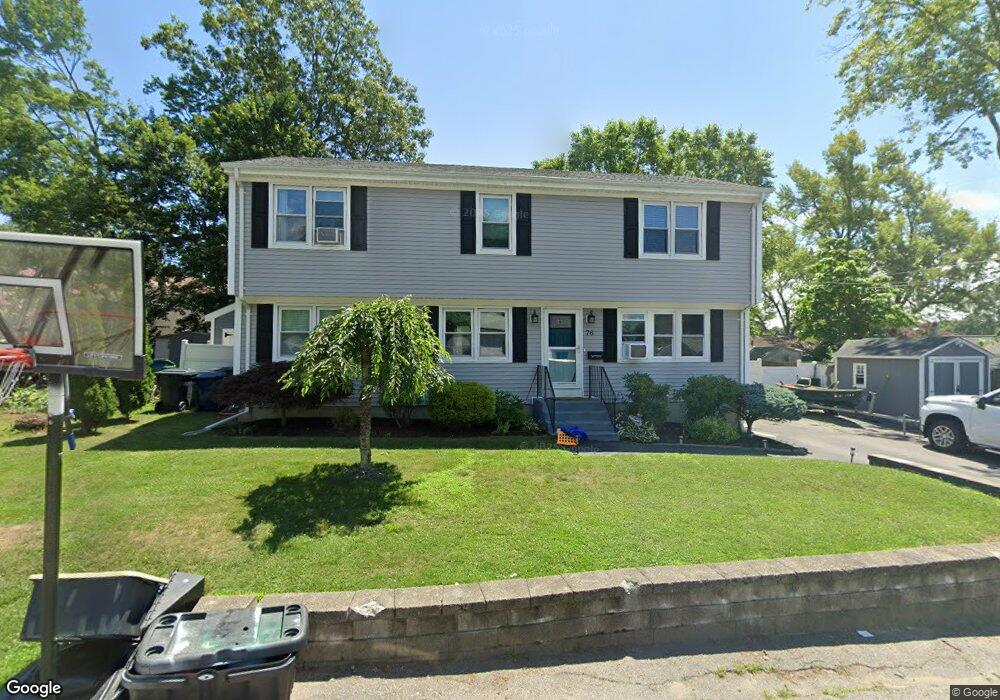
76 Ormsby Ave Warwick, RI 02886
Hillsgrove NeighborhoodEstimated Value: $462,000 - $542,000
5
Beds
2
Baths
2,950
Sq Ft
$166/Sq Ft
Est. Value
About This Home
This home is located at 76 Ormsby Ave, Warwick, RI 02886 and is currently estimated at $489,662, approximately $165 per square foot. 76 Ormsby Ave is a home located in Kent County with nearby schools including St Rose Of Lima School.
Ownership History
Date
Name
Owned For
Owner Type
Purchase Details
Closed on
Sep 19, 2011
Sold by
Varrecchia Patrick W and Lopes Michele R
Bought by
Varrecchia Patrick W and Verrecchia Michele R
Current Estimated Value
Home Financials for this Owner
Home Financials are based on the most recent Mortgage that was taken out on this home.
Original Mortgage
$213,541
Interest Rate
4.62%
Mortgage Type
FHA
Purchase Details
Closed on
Oct 26, 2009
Sold by
Brauninger Timothy J
Bought by
Varrecchia Patrick W and Lopes Michele R
Purchase Details
Closed on
Jun 28, 2002
Sold by
Toll William G and Toll Brenda E
Bought by
Brauninger Sharmaine J and Brauninger Timothy J
Purchase Details
Closed on
Nov 23, 1992
Sold by
Sylvia Joseph F and Pettinato Karen
Bought by
Toll William G and Toll Brenda
Create a Home Valuation Report for This Property
The Home Valuation Report is an in-depth analysis detailing your home's value as well as a comparison with similar homes in the area
Home Values in the Area
Average Home Value in this Area
Purchase History
| Date | Buyer | Sale Price | Title Company |
|---|---|---|---|
| Varrecchia Patrick W | -- | -- | |
| Varrecchia Patrick W | $176,400 | -- | |
| Varrecchia Patricka W | $176,400 | -- | |
| Brauninger Sharmaine J | $254,500 | -- | |
| Toll William G | $108,000 | -- | |
| Toll William G | $108,000 | -- |
Source: Public Records
Mortgage History
| Date | Status | Borrower | Loan Amount |
|---|---|---|---|
| Open | Toll William G | $210,275 | |
| Closed | Toll William G | $213,541 |
Source: Public Records
Tax History
| Year | Tax Paid | Tax Assessment Tax Assessment Total Assessment is a certain percentage of the fair market value that is determined by local assessors to be the total taxable value of land and additions on the property. | Land | Improvement |
|---|---|---|---|---|
| 2025 | $5,450 | $429,100 | $101,600 | $327,500 |
| 2024 | $5,228 | $361,300 | $83,900 | $277,400 |
| 2023 | $5,127 | $361,300 | $83,900 | $277,400 |
| 2022 | $5,080 | $271,200 | $53,800 | $217,400 |
| 2021 | $5,080 | $271,200 | $53,800 | $217,400 |
| 2020 | $5,080 | $271,200 | $53,800 | $217,400 |
| 2019 | $5,080 | $271,200 | $53,800 | $217,400 |
| 2018 | $4,653 | $223,700 | $45,400 | $178,300 |
| 2017 | $4,528 | $223,700 | $45,400 | $178,300 |
| 2016 | $4,528 | $223,700 | $45,400 | $178,300 |
| 2015 | $4,555 | $219,500 | $55,400 | $164,100 |
| 2014 | $4,403 | $219,500 | $55,400 | $164,100 |
| 2013 | $4,344 | $219,500 | $55,400 | $164,100 |
Source: Public Records
Map
Nearby Homes
- 211 Pinnery Ave
- 28 Hoyt St
- 65 Almy St
- 28 Burgess Dr
- 44 Westbrook Rd
- 38 Red Maple Ln
- 88 Child Ln
- 96 Moccasin Dr
- 38 Bowman Dr
- 86 Red Maple Ln
- 62 Red Maple Ln
- 72 Hollis Ave
- 207 Stillwater Dr
- 161 Sunny Cove Dr
- 700 Sandy Ln Unit 16
- 700 Sandy Ln Unit 3
- 700 Sandy Ln Unit 5
- 700 Sandy Ln Unit 19
- 700 Sandy Ln Unit 4
- 700 Sandy Ln Unit 20
Your Personal Tour Guide
Ask me questions while you tour the home.