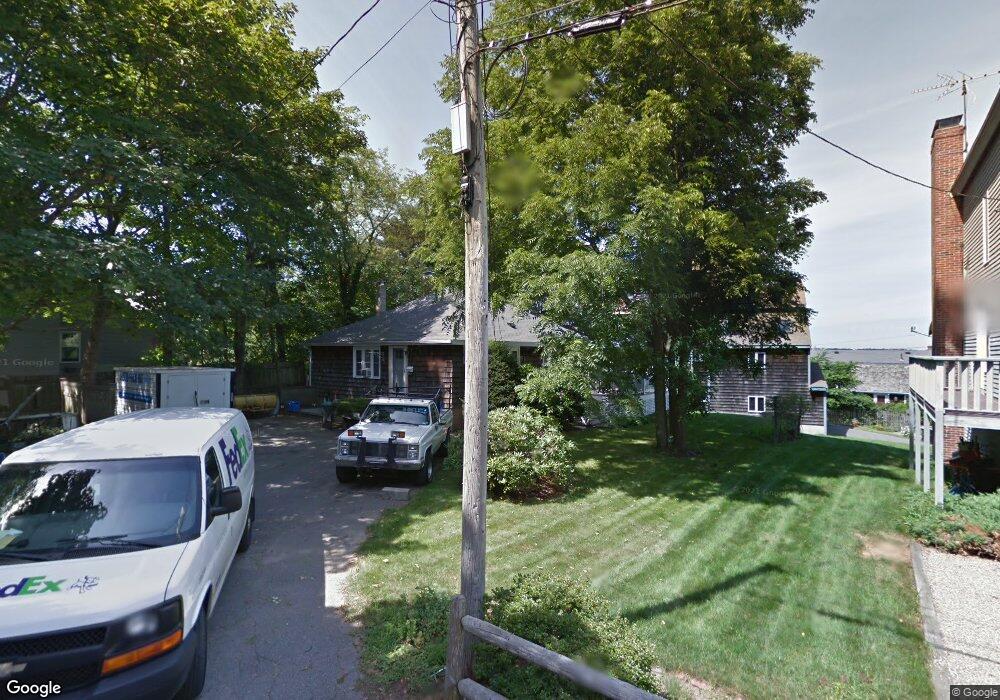
76 Pitman Rd Marblehead, MA 01945
Estimated Value: $756,000 - $1,642,000
3
Beds
2
Baths
2,240
Sq Ft
$466/Sq Ft
Est. Value
About This Home
This home is located at 76 Pitman Rd, Marblehead, MA 01945 and is currently estimated at $1,044,166, approximately $466 per square foot. 76 Pitman Rd is a home located in Essex County with nearby schools including Marblehead High School, Marblehead Community Charter Public School, and Tower School.
Ownership History
Date
Name
Owned For
Owner Type
Purchase Details
Closed on
Jul 2, 2025
Sold by
Perry Ann M
Bought by
Ann M Perry Ret and Perry
Current Estimated Value
Purchase Details
Closed on
Aug 17, 1990
Sold by
Lavoie Anne F
Bought by
Radochia Ann M
Create a Home Valuation Report for This Property
The Home Valuation Report is an in-depth analysis detailing your home's value as well as a comparison with similar homes in the area
Home Values in the Area
Average Home Value in this Area
Purchase History
| Date | Buyer | Sale Price | Title Company |
|---|---|---|---|
| Ann M Perry Ret | -- | -- | |
| Ann M Perry Ret | -- | -- | |
| Ann M Perry Ret | -- | -- | |
| Radochia Ann M | $150,000 | -- | |
| Radochia Ann M | $150,000 | -- |
Source: Public Records
Mortgage History
| Date | Status | Borrower | Loan Amount |
|---|---|---|---|
| Previous Owner | Radochia Ann M | $167,000 | |
| Previous Owner | Radochia Ann M | $210,000 | |
| Previous Owner | Radochia Ann M | $215,000 |
Source: Public Records
Tax History
| Year | Tax Paid | Tax Assessment Tax Assessment Total Assessment is a certain percentage of the fair market value that is determined by local assessors to be the total taxable value of land and additions on the property. | Land | Improvement |
|---|---|---|---|---|
| 2025 | $6,330 | $699,400 | $467,400 | $232,000 |
| 2024 | $5,998 | $669,400 | $502,500 | $166,900 |
| 2023 | $6,416 | $641,600 | $438,200 | $203,400 |
| 2022 | $6,176 | $587,100 | $385,600 | $201,500 |
| 2021 | $5,697 | $546,700 | $373,900 | $172,800 |
| 2020 | $5,295 | $509,600 | $362,300 | $147,300 |
| 2019 | $5,304 | $493,900 | $338,900 | $155,000 |
| 2018 | $5,314 | $482,200 | $327,200 | $155,000 |
| 2017 | $4,859 | $441,300 | $292,100 | $149,200 |
| 2016 | $4,661 | $419,900 | $268,800 | $151,100 |
| 2015 | $4,154 | $374,900 | $257,100 | $117,800 |
| 2014 | $3,735 | $336,800 | $222,000 | $114,800 |
Source: Public Records
Map
Nearby Homes
- 21 Kenneth Rd
- 89 Naugus Ave
- 157 Green St Unit 157
- 1 Knollwood Rd
- 9 Lincoln Park
- 4 Broadmere Way
- 55 Roosevelt Ave
- 3 Frost Ln Unit 1
- 132 Elm St
- 132 Elm St Unit 132
- 6 Mount Vernon St
- 45 Pleasant St
- 66 Pleasant St Unit 1
- 66 Pleasant St Unit 2
- 7 Mechanic Ct
- 30 Haley Rd Unit 1
- 26 Summer St Unit 1
- 290 Washington St Unit A
- 9 Darling St
- 5 Winter Island Rd
Your Personal Tour Guide
Ask me questions while you tour the home.