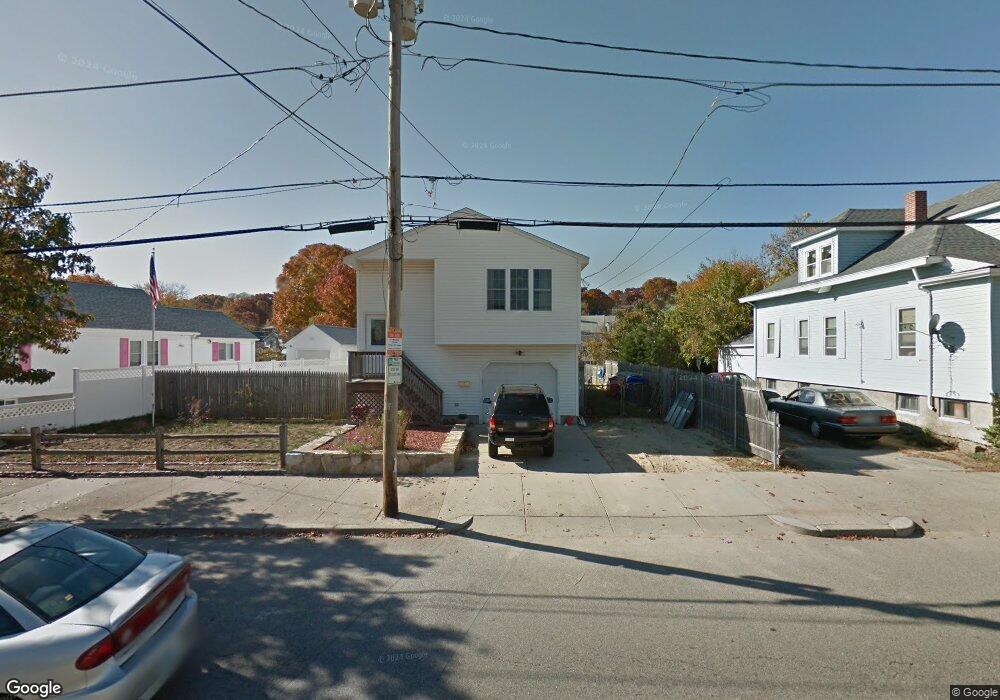
76 Power Rd Pawtucket, RI 02860
Fairlawn NeighborhoodEstimated Value: $396,000 - $486,000
3
Beds
2
Baths
1,178
Sq Ft
$376/Sq Ft
Est. Value
About This Home
This home is located at 76 Power Rd, Pawtucket, RI 02860 and is currently estimated at $443,344, approximately $376 per square foot. 76 Power Rd is a home located in Providence County with nearby schools including Times Squared Academy, The San Miguel School, and Bishop Keough Regional High School.
Ownership History
Date
Name
Owned For
Owner Type
Purchase Details
Closed on
Sep 27, 2021
Sold by
Morrissey Donna L
Bought by
Morrissey Donna L and Morrissey John J
Current Estimated Value
Purchase Details
Closed on
May 3, 2007
Sold by
Cocci Michael J
Bought by
Morrissey Donna L
Home Financials for this Owner
Home Financials are based on the most recent Mortgage that was taken out on this home.
Original Mortgage
$175,000
Interest Rate
6.23%
Mortgage Type
Purchase Money Mortgage
Create a Home Valuation Report for This Property
The Home Valuation Report is an in-depth analysis detailing your home's value as well as a comparison with similar homes in the area
Home Values in the Area
Average Home Value in this Area
Purchase History
| Date | Buyer | Sale Price | Title Company |
|---|---|---|---|
| Morrissey Donna L | -- | None Available | |
| Morrissey Donna L | $270,000 | -- |
Source: Public Records
Mortgage History
| Date | Status | Borrower | Loan Amount |
|---|---|---|---|
| Previous Owner | Morrissey Donna L | $175,000 |
Source: Public Records
Tax History
| Year | Tax Paid | Tax Assessment Tax Assessment Total Assessment is a certain percentage of the fair market value that is determined by local assessors to be the total taxable value of land and additions on the property. | Land | Improvement |
|---|---|---|---|---|
| 2025 | $5,100 | $387,800 | $154,400 | $233,400 |
| 2024 | $4,785 | $387,800 | $154,400 | $233,400 |
| 2023 | $4,381 | $258,600 | $74,200 | $184,400 |
| 2022 | $4,288 | $258,600 | $74,200 | $184,400 |
| 2021 | $4,288 | $258,600 | $74,200 | $184,400 |
| 2020 | $4,485 | $214,700 | $58,900 | $155,800 |
| 2019 | $4,485 | $214,700 | $58,900 | $155,800 |
| 2018 | $4,322 | $214,700 | $58,900 | $155,800 |
| 2017 | $4,040 | $177,800 | $54,900 | $122,900 |
| 2016 | $3,892 | $177,800 | $54,900 | $122,900 |
| 2015 | $3,892 | $177,800 | $54,900 | $122,900 |
| 2014 | $4,301 | $186,500 | $61,000 | $125,500 |
Source: Public Records
Map
Nearby Homes
- 116 Toledo Ave
- 119 Edgeworth Ave
- 136 Windmill St
- 40 Wilna St
- 0 Piave St
- 50 Batcheller Ave
- 18 Fairmont Ave
- 19 Benedict St
- 25 Blaine St
- 862 Charles St
- 15 Job St
- 20 Gridley St
- 198 Ledge St
- 41 Campbell Terrace
- 180 Ledge St
- 85 Ledge St
- 10 Josephine St Unit 310
- 20 Hurdis St Unit 1
- 93 Paul St
- 158 Newell Ave
Your Personal Tour Guide
Ask me questions while you tour the home.