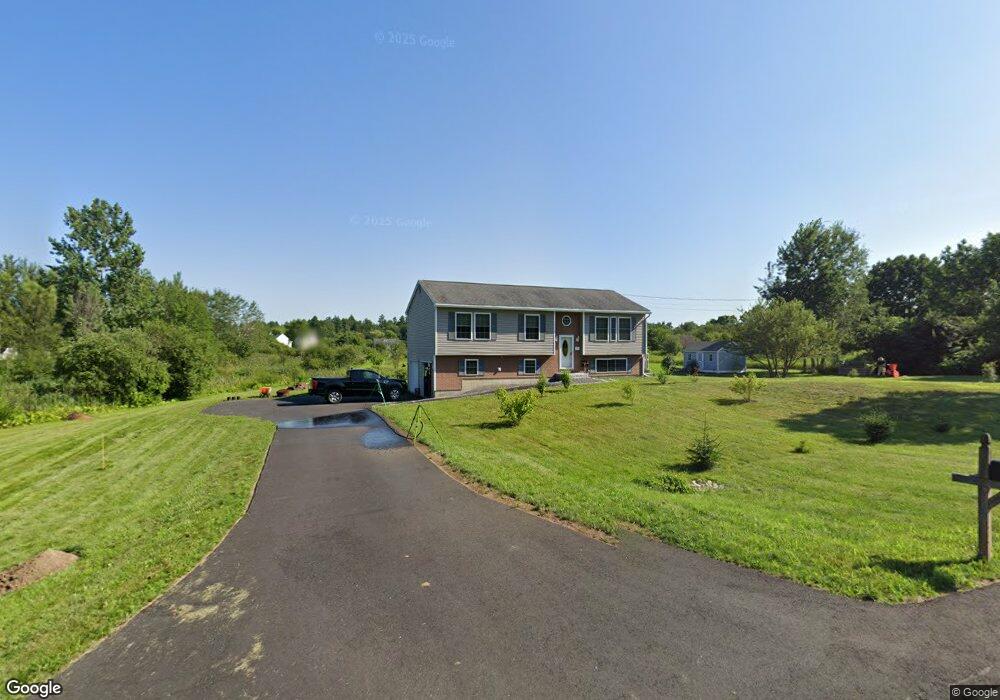
76 Queen St Gorham, ME 04038
Estimated Value: $461,553 - $531,000
3
Beds
1
Bath
1,144
Sq Ft
$435/Sq Ft
Est. Value
About This Home
This home is located at 76 Queen St, Gorham, ME 04038 and is currently estimated at $497,138, approximately $434 per square foot. 76 Queen St is a home located in Cumberland County with nearby schools including Great Falls Elementary School, Gorham Middle School, and Gorham High School.
Ownership History
Date
Name
Owned For
Owner Type
Purchase Details
Closed on
Jul 8, 2010
Sold by
Gilbert Homes Inc
Bought by
Handy Truman D
Current Estimated Value
Home Financials for this Owner
Home Financials are based on the most recent Mortgage that was taken out on this home.
Original Mortgage
$168,000
Outstanding Balance
$109,788
Interest Rate
4.78%
Mortgage Type
Unknown
Estimated Equity
$387,350
Purchase Details
Closed on
Sep 22, 2009
Sold by
Tucker Kristina L
Bought by
Gilbert Homes Inc
Create a Home Valuation Report for This Property
The Home Valuation Report is an in-depth analysis detailing your home's value as well as a comparison with similar homes in the area
Home Values in the Area
Average Home Value in this Area
Purchase History
| Date | Buyer | Sale Price | Title Company |
|---|---|---|---|
| Handy Truman D | -- | -- | |
| Gilbert Homes Inc | -- | -- |
Source: Public Records
Mortgage History
| Date | Status | Borrower | Loan Amount |
|---|---|---|---|
| Open | Gilbert Homes Inc | $168,000 |
Source: Public Records
Tax History
| Year | Tax Paid | Tax Assessment Tax Assessment Total Assessment is a certain percentage of the fair market value that is determined by local assessors to be the total taxable value of land and additions on the property. | Land | Improvement |
|---|---|---|---|---|
| 2025 | $5,174 | $349,600 | $112,100 | $237,500 |
| 2024 | $5,139 | $349,600 | $112,100 | $237,500 |
| 2023 | $4,690 | $341,100 | $112,100 | $229,000 |
| 2022 | $4,383 | $341,100 | $112,100 | $229,000 |
| 2021 | $3,806 | $196,200 | $83,500 | $112,700 |
| 2020 | $3,728 | $196,200 | $83,500 | $112,700 |
| 2019 | $3,718 | $196,200 | $83,500 | $112,700 |
| 2018 | $3,571 | $196,200 | $83,500 | $112,700 |
| 2017 | $3,321 | $194,200 | $83,500 | $110,700 |
| 2016 | $3,303 | $194,300 | $83,600 | $110,700 |
| 2015 | $3,167 | $194,300 | $83,600 | $110,700 |
| 2014 | $2,761 | $158,700 | $63,600 | $95,100 |
| 2013 | $2,746 | $158,700 | $63,600 | $95,100 |
Source: Public Records
Map
Nearby Homes
- 0 Libby Ave
- 209 Mosher Rd
- 22 Gateway Commons Dr
- 194 Falcon Crest Dr Unit 60
- 192 Falcon Crest Dr Unit 59
- 195 Falcon Crest Dr Unit 34
- 188 Falcon Crest Dr Unit 58
- 193 Falcon Crest Dr Unit 33
- 191 Falcon Crest Dr Unit 32
- 182 Falcon Crest Dr Unit 56
- 189 Falcon Crest Dr Unit 31
- 187 Falcon Crest Dr Unit 30
- 185 Falcon Crest Dr Unit 29
- 0 Cobb Rd
- 127 Falcon Crest Dr Unit 4
- 25 Patio Park Ln
- 14 Patio Park Ln
- 7 Trestle Way
- 52 Hogan Cir Unit 1
- 51 Newell St
Your Personal Tour Guide
Ask me questions while you tour the home.