Estimated Value: $522,000 - $594,000
4
Beds
2
Baths
2,012
Sq Ft
$273/Sq Ft
Est. Value
About This Home
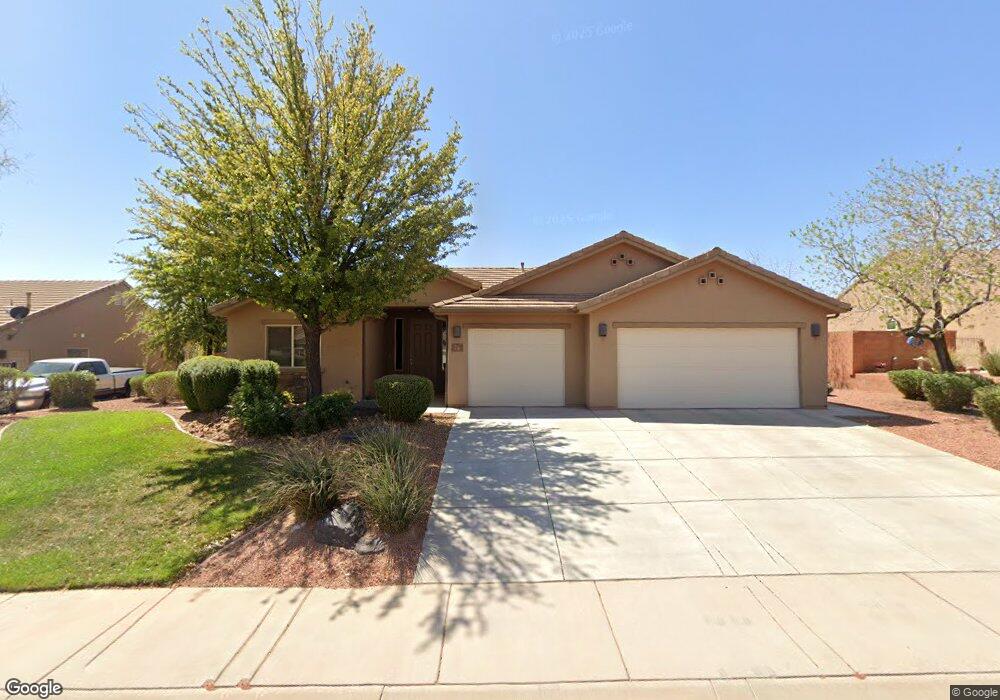
This home is located at 76 S 330 W Unit 27, Ivins, UT 84738 and is currently estimated at $548,730, approximately $272 per square foot. 76 S 330 W Unit 27 is a home located in Washington County with nearby schools including Snow Canyon Middle School, Lava Ridge Intermediate School, and Snow Canyon High School.
Ownership History
Date
Name
Owned For
Owner Type
Purchase Details
Closed on
May 31, 2024
Sold by
Burrell Kevin J and Burrell Jennifer D
Bought by
Bennett Living Trust and Bennett
Current Estimated Value
Purchase Details
Closed on
Jun 10, 2017
Sold by
Burreli Kevin J and Burreli Jennifer D
Bought by
Burrell Kevin J and Burrell Jennifer D
Home Financials for this Owner
Home Financials are based on the most recent Mortgage that was taken out on this home.
Original Mortgage
$200,000
Interest Rate
4.02%
Mortgage Type
New Conventional
Purchase Details
Closed on
Jun 23, 2009
Sold by
Sun Crest Development Property Llc
Bought by
Burrell Kevin J and Burrell Jennifer D
Home Financials for this Owner
Home Financials are based on the most recent Mortgage that was taken out on this home.
Original Mortgage
$227,121
Interest Rate
4.83%
Mortgage Type
Purchase Money Mortgage
Create a Home Valuation Report for This Property
The Home Valuation Report is an in-depth analysis detailing your home's value as well as a comparison with similar homes in the area
Home Values in the Area
Average Home Value in this Area
Purchase History
| Date | Buyer | Sale Price | Title Company |
|---|---|---|---|
| Bennett Living Trust | -- | Eagle Gate Title Insurance Agc | |
| Burrell Kevin J | -- | Pinnacle Title | |
| Burrell Kevin J | -- | Southern Utah Title |
Source: Public Records
Mortgage History
| Date | Status | Borrower | Loan Amount |
|---|---|---|---|
| Previous Owner | Burrell Kevin J | $200,000 | |
| Previous Owner | Burrell Kevin J | $227,121 |
Source: Public Records
Tax History Compared to Growth
Tax History
| Year | Tax Paid | Tax Assessment Tax Assessment Total Assessment is a certain percentage of the fair market value that is determined by local assessors to be the total taxable value of land and additions on the property. | Land | Improvement |
|---|---|---|---|---|
| 2025 | $1,024 | $273,185 | $82,500 | $190,685 |
| 2023 | $1,836 | $269,005 | $60,500 | $208,505 |
| 2022 | $1,913 | $263,890 | $60,500 | $203,390 |
| 2021 | $1,828 | $374,600 | $80,000 | $294,600 |
| 2020 | $1,697 | $329,200 | $75,000 | $254,200 |
| 2019 | $1,706 | $323,600 | $60,000 | $263,600 |
| 2018 | $1,654 | $161,425 | $0 | $0 |
| 2017 | $1,575 | $149,545 | $0 | $0 |
| 2016 | $1,599 | $140,195 | $0 | $0 |
| 2015 | $1,612 | $136,125 | $0 | $0 |
| 2014 | $1,681 | $142,615 | $0 | $0 |
Source: Public Records
Map
Nearby Homes
- 97 S 495 W
- 262 W 200 S
- 148 S 200 W
- 704 W Desert Dove Ln
- 716 W Desert Dove Ln
- 692 W Desert Dove Ln
- 692 W Desert Dove Ln Unit (lot 3)
- 744 W Desert Dove Ln
- 744 W Desert Dove Ln Unit (lot 7)
- 88 N Apex Ln
- 480 W Tonapah Way
- 576 W 30 S
- 543 W 80 S
- 336 W 270 S
- 140 W Center St Unit 20
- 257 S 230 W
- 582 W W 80 S
- 108 N Arrowhead Ln
- 492 S Memory Ln
- 12 N 640 W