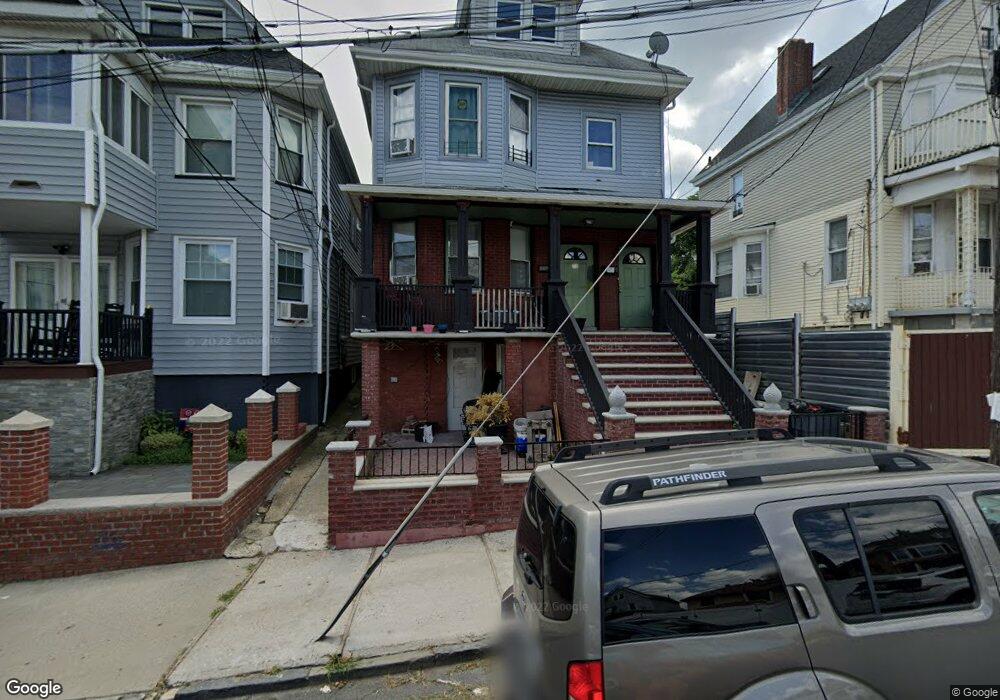
76 Sands St Staten Island, NY 10304
Stapleton NeighborhoodEstimated Value: $586,637 - $778,000
--
Bed
--
Bath
2,178
Sq Ft
$332/Sq Ft
Est. Value
About This Home
This home is located at 76 Sands St, Staten Island, NY 10304 and is currently estimated at $722,409, approximately $331 per square foot. 76 Sands St is a home located in Richmond County with nearby schools including P.S. 16 John J Driscoll, P.S. 74 Future Leaders Elementary School, and Fort Hill Collaborative Elementary.
Ownership History
Date
Name
Owned For
Owner Type
Purchase Details
Closed on
Aug 17, 1998
Sold by
Beneficial Homeowner Service Corp
Bought by
Fairweather Carlos
Current Estimated Value
Purchase Details
Closed on
Feb 4, 1998
Sold by
Gross Deanna and Downing Alphonso
Bought by
Beneficial Homeowner Service Corp
Create a Home Valuation Report for This Property
The Home Valuation Report is an in-depth analysis detailing your home's value as well as a comparison with similar homes in the area
Home Values in the Area
Average Home Value in this Area
Purchase History
| Date | Buyer | Sale Price | Title Company |
|---|---|---|---|
| Fairweather Carlos | $75,000 | First American Title Ins Co | |
| Beneficial Homeowner Service Corp | $132,500 | First American Title Ins Co |
Source: Public Records
Tax History Compared to Growth
Tax History
| Year | Tax Paid | Tax Assessment Tax Assessment Total Assessment is a certain percentage of the fair market value that is determined by local assessors to be the total taxable value of land and additions on the property. | Land | Improvement |
|---|---|---|---|---|
| 2025 | $4,956 | $40,380 | $4,060 | $36,320 |
| 2024 | $4,968 | $35,460 | $4,545 | $30,915 |
| 2023 | $4,842 | $25,240 | $3,834 | $21,406 |
| 2022 | $4,467 | $39,480 | $6,180 | $33,300 |
| 2021 | $4,425 | $33,420 | $6,180 | $27,240 |
| 2020 | $4,793 | $36,960 | $6,180 | $30,780 |
| 2019 | $4,663 | $32,760 | $6,180 | $26,580 |
| 2018 | $3,990 | $21,033 | $5,583 | $15,450 |
| 2017 | $3,745 | $19,843 | $5,856 | $13,987 |
| 2016 | $3,432 | $18,720 | $6,180 | $12,540 |
| 2015 | $3,170 | $18,420 | $5,160 | $13,260 |
| 2014 | $3,170 | $18,109 | $5,073 | $13,036 |
Source: Public Records
Map
Nearby Homes