Estimated Value: $591,000 - $677,000
4
Beds
2
Baths
2,088
Sq Ft
$310/Sq Ft
Est. Value
About This Home
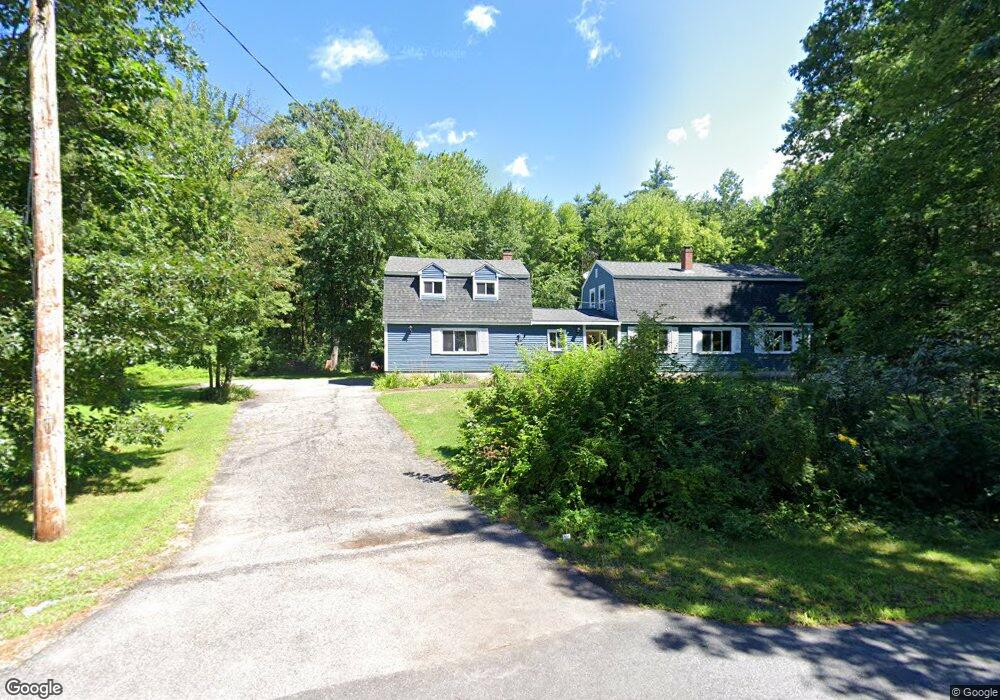
This home is located at 76 Settlers Retreat Rd, Wells, ME 04090 and is currently estimated at $647,971, approximately $310 per square foot. 76 Settlers Retreat Rd is a home located in York County with nearby schools including Wells Elementary School, Wells Junior High School, and Wells High School.
Ownership History
Date
Name
Owned For
Owner Type
Purchase Details
Closed on
Apr 1, 2024
Sold by
Moore Sean C and Moore Brin M
Bought by
Moore House T and Moore M
Current Estimated Value
Purchase Details
Closed on
Feb 3, 2015
Sold by
Moore Sean C and Moore Brin M
Bought by
Moore Sean C and Moore Brin M
Purchase Details
Closed on
May 28, 2014
Sold by
Walker Melissa A
Bought by
Moore Sean C and Richer Brin M
Home Financials for this Owner
Home Financials are based on the most recent Mortgage that was taken out on this home.
Original Mortgage
$244,138
Interest Rate
4.26%
Mortgage Type
VA
Purchase Details
Closed on
Aug 1, 2011
Sold by
Flint James D and Flint Sylvia M
Bought by
Walker Melissa A
Home Financials for this Owner
Home Financials are based on the most recent Mortgage that was taken out on this home.
Original Mortgage
$184,000
Interest Rate
4.52%
Mortgage Type
Purchase Money Mortgage
Create a Home Valuation Report for This Property
The Home Valuation Report is an in-depth analysis detailing your home's value as well as a comparison with similar homes in the area
Home Values in the Area
Average Home Value in this Area
Purchase History
| Date | Buyer | Sale Price | Title Company |
|---|---|---|---|
| Moore House T | -- | None Available | |
| Moore House T | -- | None Available | |
| Moore Sean C | -- | -- | |
| Moore Sean C | -- | -- | |
| Moore Sean C | -- | -- | |
| Moore Sean C | -- | -- | |
| Walker Melissa A | -- | -- | |
| Walker Melissa A | -- | -- |
Source: Public Records
Mortgage History
| Date | Status | Borrower | Loan Amount |
|---|---|---|---|
| Previous Owner | Moore Sean C | $244,138 | |
| Previous Owner | Walker Melissa A | $184,000 |
Source: Public Records
Tax History Compared to Growth
Tax History
| Year | Tax Paid | Tax Assessment Tax Assessment Total Assessment is a certain percentage of the fair market value that is determined by local assessors to be the total taxable value of land and additions on the property. | Land | Improvement |
|---|---|---|---|---|
| 2024 | $3,966 | $652,360 | $132,360 | $520,000 |
| 2023 | $3,888 | $652,360 | $132,360 | $520,000 |
| 2022 | $3,451 | $329,940 | $60,120 | $269,820 |
| 2021 | $3,410 | $324,160 | $56,190 | $267,970 |
| 2020 | $3,209 | $306,170 | $60,120 | $246,050 |
| 2019 | $3,175 | $304,660 | $60,120 | $244,540 |
| 2018 | $3,097 | $300,130 | $60,120 | $240,010 |
| 2017 | $2,872 | $282,690 | $60,120 | $222,570 |
| 2016 | $2,844 | $282,690 | $60,120 | $222,570 |
| 2015 | $2,813 | $282,690 | $60,120 | $222,570 |
| 2013 | $2,578 | $282,690 | $60,120 | $222,570 |
Source: Public Records
Map
Nearby Homes
- 43 Michaels Rd
- 86 Moose Bog Ln
- 45 Grace Ln
- Lot 11 Laney Ln
- 761 Quarry Rd
- Lot 13 Laney Ln
- Lot 4 Tbd Lentago Ln Unit Lot 4
- 22 Lentago Ln
- 42 Bernice Ave
- 94 Perry Oliver Rd
- lot 6 Bragdon Rd
- 1229 Bragdon Rd
- 469 High St
- 2196 Sanford Rd Unit 46
- 99 Westhaven Ln
- 85 Westhaven Ln
- Lot 8 Rolling Woods Ln
- Lot 12 Rolling Woods Ln
- Lot 5 Rolling Woods Ln
- Lot 6 Rolling Woods Ln
- 0 Settler's Retreat
- 69 Settlers Retreat Rd
- 72 Settlers Retreat Rd
- 59 Settlers Retreat Rd
- 50 Settlers Retreat Rd
- 45 Settlers Retreat Rd
- 60 Settlers Retreat Rd
- 42 Settlers Retreat Rd
- 33 Settlers Retreat Rd
- 19 Settlers Retreat Rd
- 345 Quarry Rd
- 1 Indian Run Cir
- 47 Mark Ave
- 325 Quarry Rd
- 7 Settlers Retreat Rd
- 88 Mark Ave
- 70 Mark Ave
- 15 Indian Run Cir
- 62 Mark Ave
- 327 Quarry Rd